
01 / 10
Pattern Track Records
See how a setup type has behaved, so you know if the next signal deserves your money.
TradingPal finds wedges, trendlines, and consolidation breakouts across stocks, crypto, and ETFs. They’re the same kinds of tight price structures that some of the world’s most successful momentum swing traders have built strategies around. Most screeners stop at the shape. TradingPal shows you the historical track record behind every qualifying setup, built on up to 39 years of market data.
TradingPal finds wedges, trendlines, and consolidation breakouts across stocks, crypto, and ETFs. They’re the same kinds of tight price structures that some of the world’s most successful momentum swing traders have built strategies around. Most screeners stop at the shape. TradingPal shows you the historical track record behind every qualifying setup, built on up to 39 years of market data.
Backtest · trading our screener's patterns · 2016–2026
The stats above are the median of 25 policy simulations — the middle of the backtest, not a lucky path — shown before trading costs; with modeled slippage and failed entries the same decade compounds at 19.3%/yr. We trade it with our own money — live results are still young, and we'll publish them here as they build. See how we backtest →
Backtested results (2016–2026) — not live trading.
That track record starts with finding the right setups.
Across 600+ symbols spanning stocks, crypto, and ETFs, the screener flags wedges, pennants, triangles, and buy-the-dip and sell-the-rip setups the day they take shape, then pairs each one with its historical track record.
Scans stocks, crypto, and ETFs for six long and short setups.
Ranks every setup by win rate and expected return using that market's available history.
Emails the #1 setup free — Premium send all 5 picks, opens 100+ ranked setups in the full screener dashboard, and adds line and breakout alerts.
One setup the scanner can find
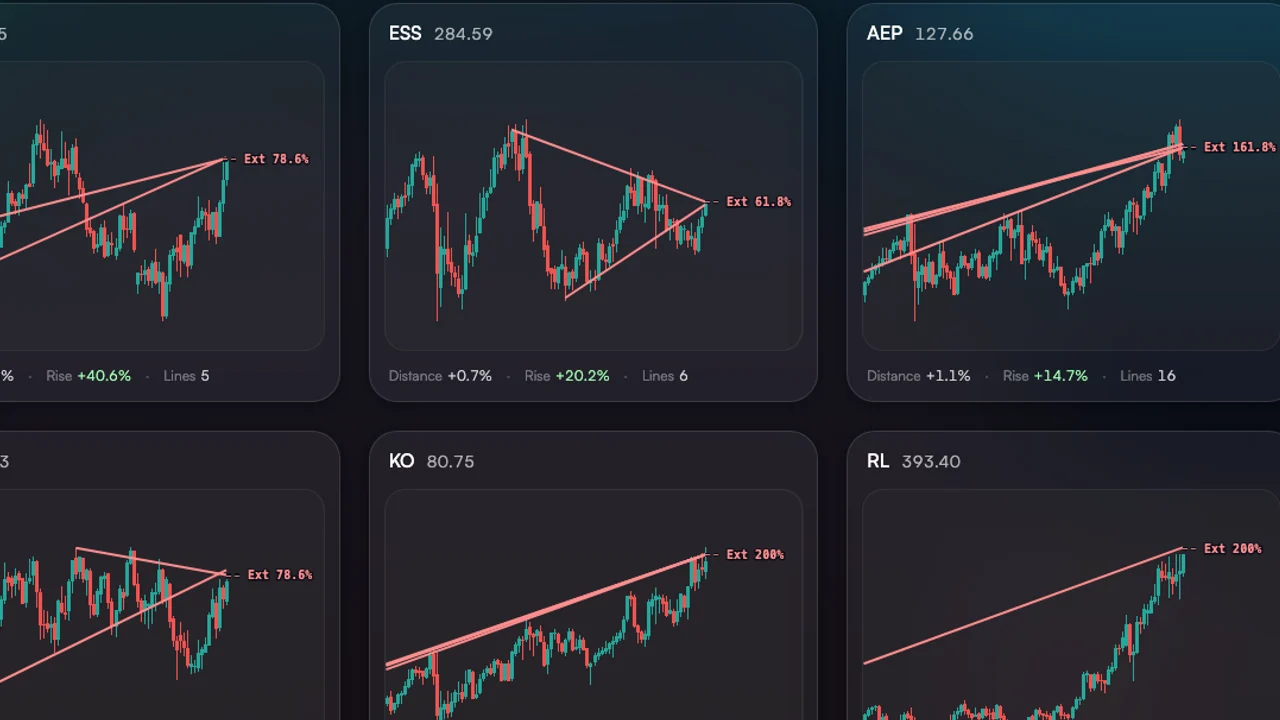
Get the day's #1 ranked setup free every morning with the ☕ Morning Brief. Premium emails all 5 picks, unlocks 100+ ranked scanner setups, and sends line and breakout alerts.
Free account · no card required · lands 8:00 AM ET
Most hand-drawn trendlines don't hold. TradingPal filters and backtests them, then draws the ones that qualify—free on every chart—with win rate, average result, and worst drawdown.
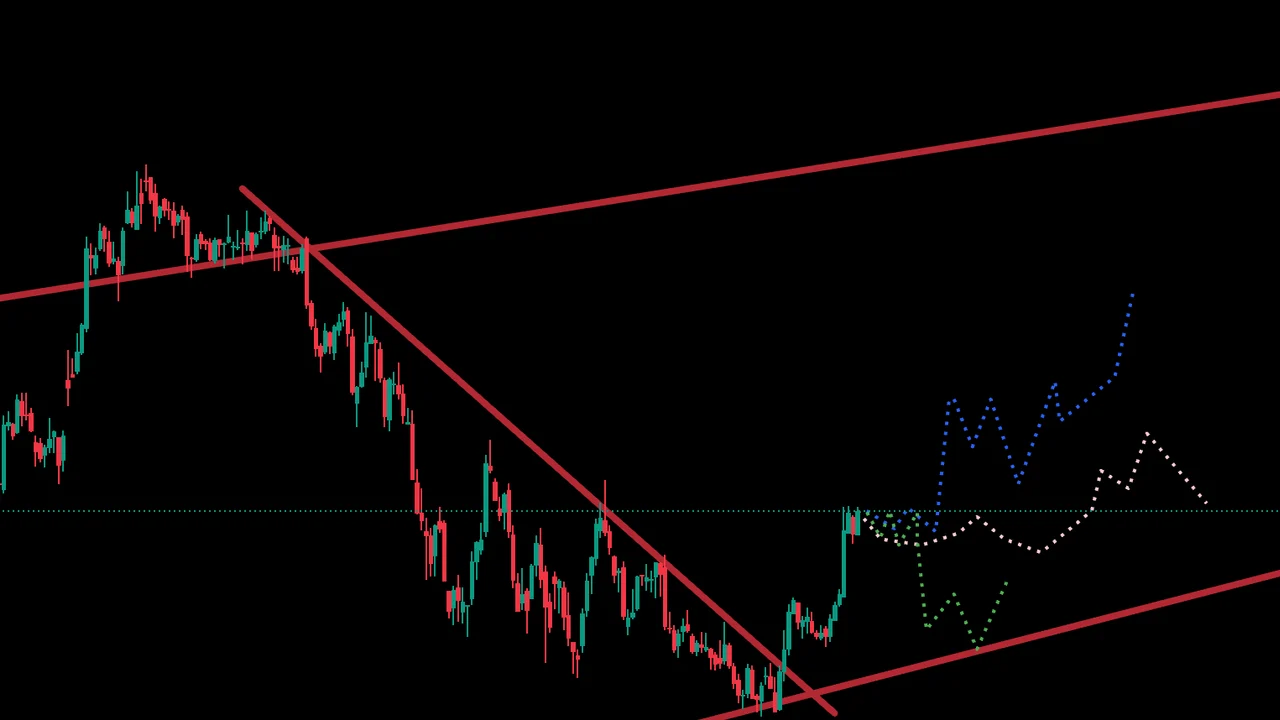
We keep adding automation so the chart does more of the reading for you — and it's still yours to draw on, override, simplify, and trade your way.
See how a setup type has behaved, so you know if the next signal deserves your money.
Copilot reads the chart's levels and patterns, then suggests an entry and stop-loss when a setup is worth taking.
Fib levels land on every chart automatically — the same map millions of traders read — so every setup speaks the language you already use.
Hover a wedge to see its projected measured-move target, drawn straight on the chart.
Hover a line to see its projected distance, expected move, and nearby fib level confluence in one read.
Layer the familiar reads you already use, then compare them with TradingPal's levels.
Drop in entry and stop levels, then let the box calculate the position size you need for 1R and what the payoff is.
Share a trendline setup in one click — no rebuilding the chart, no clutter in the image.
Get suggested entries and invalidation points that you can accept, adjust, or ignore.
Step through prior patterns and see the path after the setup, not just the headline result.
Free gives you the charting and evidence for the symbol in front of you. Premium adds complete history, the full market scanner, and alerts across the symbols you follow.
Chart stocks, crypto, and ETFs for free.
Scan, replay, and set alerts across stocks, crypto, and ETFs.
TradingPal charting includes Auto Lines and Straight Lines.
TradingPal charting includes Auto Lines and Straight Lines.
See the latest detected pattern on any chart.
See every historical pattern detected on every chart.
Get the #1 ranked setup each morning.
Get all 5 ranked Morning Brief setups, explore 100+ setups in the full market scanner, and receive line and breakout alerts.
The full market scanner is not included with Free.
Open the full market scanner and see every qualifying setup it finds.
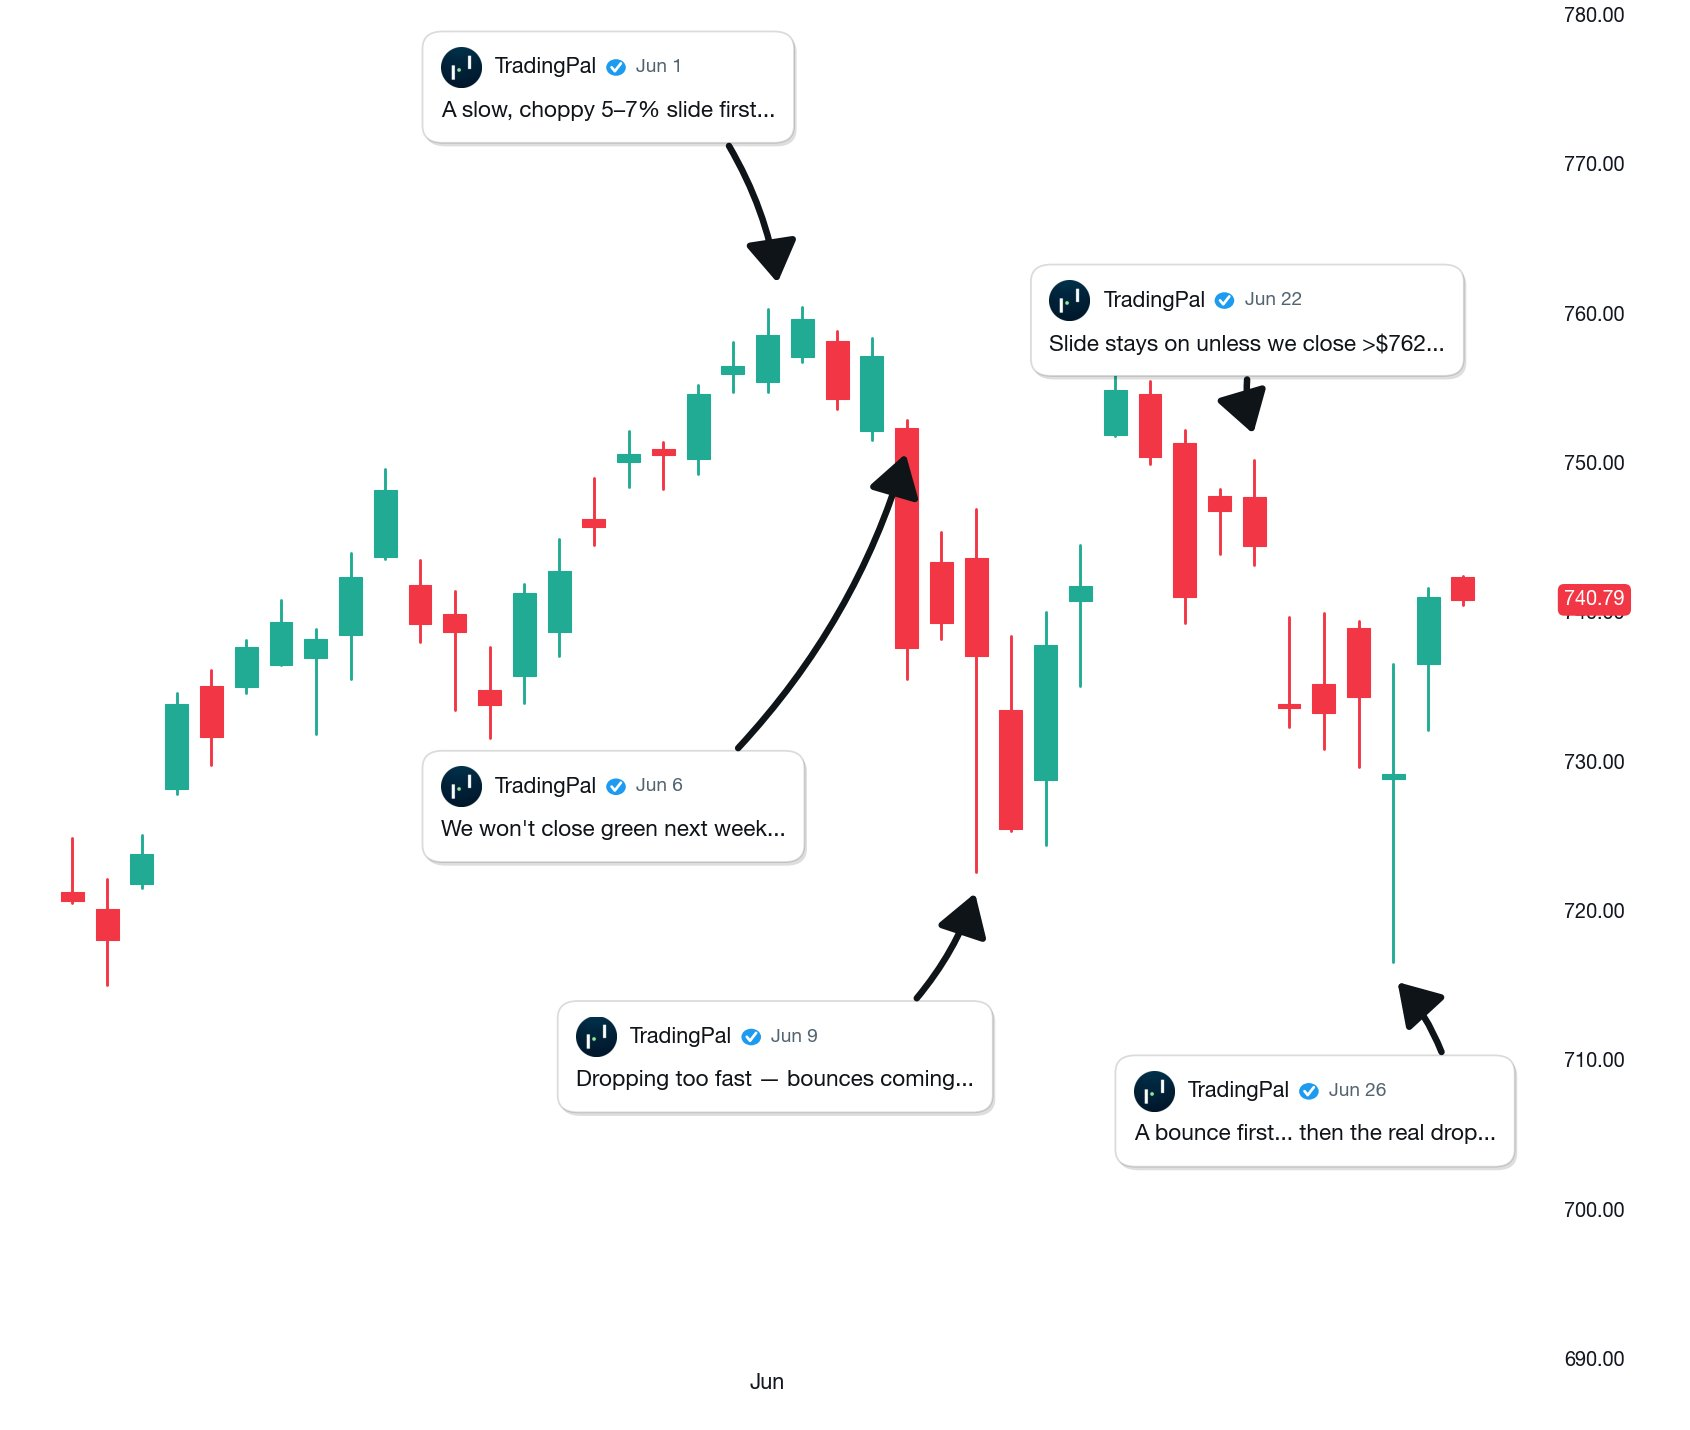
Then upgrade when you want TradingPal watching every chart, every consolidation, and every breakout with you.