
+9.3%Typical return43.6%Won1.7%To entry
SonosSONOLong
Triangle
$1.8B capVol 0th percentileRSI 50Hardware & Electronics
Swing trades without staring at the screen all day
We look across stocks & crypto for breakout patterns that form right before a large run. We apply our research to sift out poorly formed patterns and rank the best opportunities. Each comes with its historical win rate and a suggested entry, stop and target.
Free with an account
How it works
The first two steps are free. Premium crosses out the patterns that tend to fail, ranks the rest and unlocks the numbers behind each one, and Premium+ hands the data to your AI agent.
Step 1Check the stocks & crypto you care aboutFree
You shouldn’t have to open every chart, every night, to find the one that’s setting up. Add up to 30 of the stocks & crypto you follow to My watchlist, up to 200 on Premium, and we check each one every night for a breakout or reversal pattern forming.
Click My watchlistTap My watchlistAdd up to 30 tickers, 200 on PremiumWe check each one every nightSonos is forming a triangle
Step 2Run your own scanFree
Open the Screener and screen 2,600+ stocks & crypto with 30 filters, from price and volume to sector. Free, no card needed.
Click ScreenerTap ScreenerStart with the whole marketPrice over $80, and up todayOnly your matches are left
3 matches
Step 3More than double your profit per tradePremium
Finviz, TradingView and TrendSpider show pages of setups without historical stats, so you have to do all the heavy lifting to avoid the bad ones. Premium’s Edge Filter does it for you: we cross out poorly formed patterns and rank the rest by how much past winners like them typically gained. In a historical simulation since 2016, they beat the S&P 500, 36% a year to 15%.
Free for 14 days, then $15 a month · Cancel in one click
Secure checkout by Stripe
Step 4Hook up your AI agentPremium+
Connect Claude Code, Codex or Cursor, then ask in plain words: “Which bullish pennants rank best right now?” Your agent answers with win rates and a suggested entry, stop and target. Requires Premium+ subscription at $30/month.
Click APIOpen the menu, then APIAdd TradingPal to your agentAsk it for the best breakoutsIt answers with win rates and a plan
claude mcp add --transport http \ tradingpal https://api.tradingpal.io/mcp CopyCopiedThen sign in to TradingPal when your agent asks.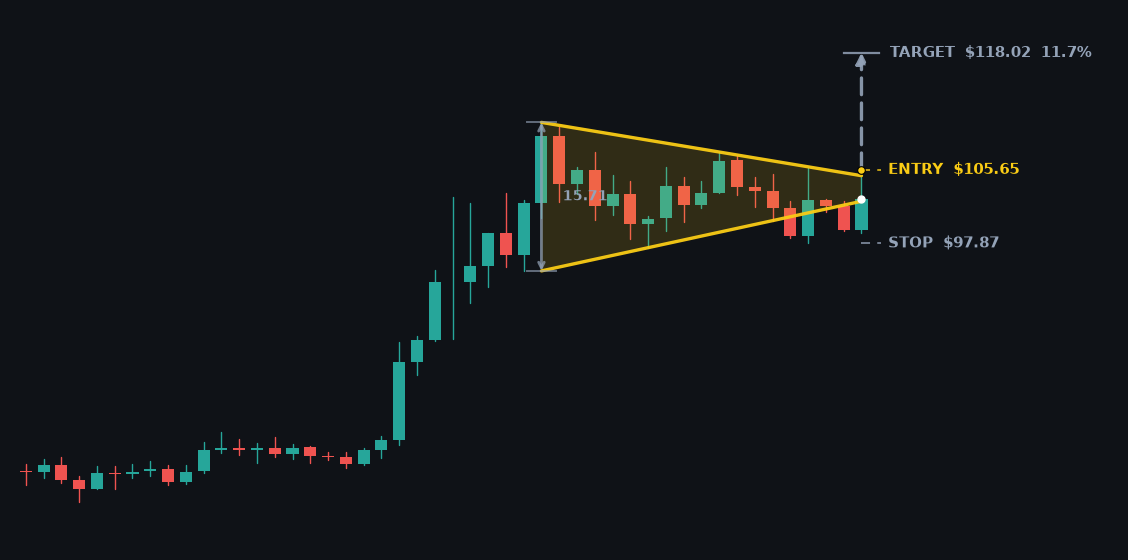 SOL-USD: entry $105.65, stop $97.87, target $118.02
How we trade
We trust our screener with our own money, and we believe we’ll significantly outperform the market based on extensive backtesting. With Premium, see what we’re about to buy.
Our own money, fixed rules, no hand-picking.
We trade the setups our screener ranks. It buys breakouts, and only sells short while the S&P 500 is below its 200-day average. Every night the screener drops the breakout patterns without a real record behind them, so what is left is what gets traded.
Each trade risks 0.65% of the account, with a stop at the last swing low.
The buy order waits at the breakout line. If price jumps over the line overnight we buy at the open, and skip it if the jump is more than 5%. Once a trade reaches its target, the stop is cancelled and we hold until it closes below its 10-day average.
26.4% a year in a provisional simulation, against 11.4% for the S&P 500.
54% of 1,998 backtested trades won, and the average win was 1.51× the average loss, from 2006 to 2026 with modeled trading costs. This is a historical simulation, not live results, and not a promise of future returns. Its deepest drop along the way was 26.7%. Every trade in it started as a setup on the screener.
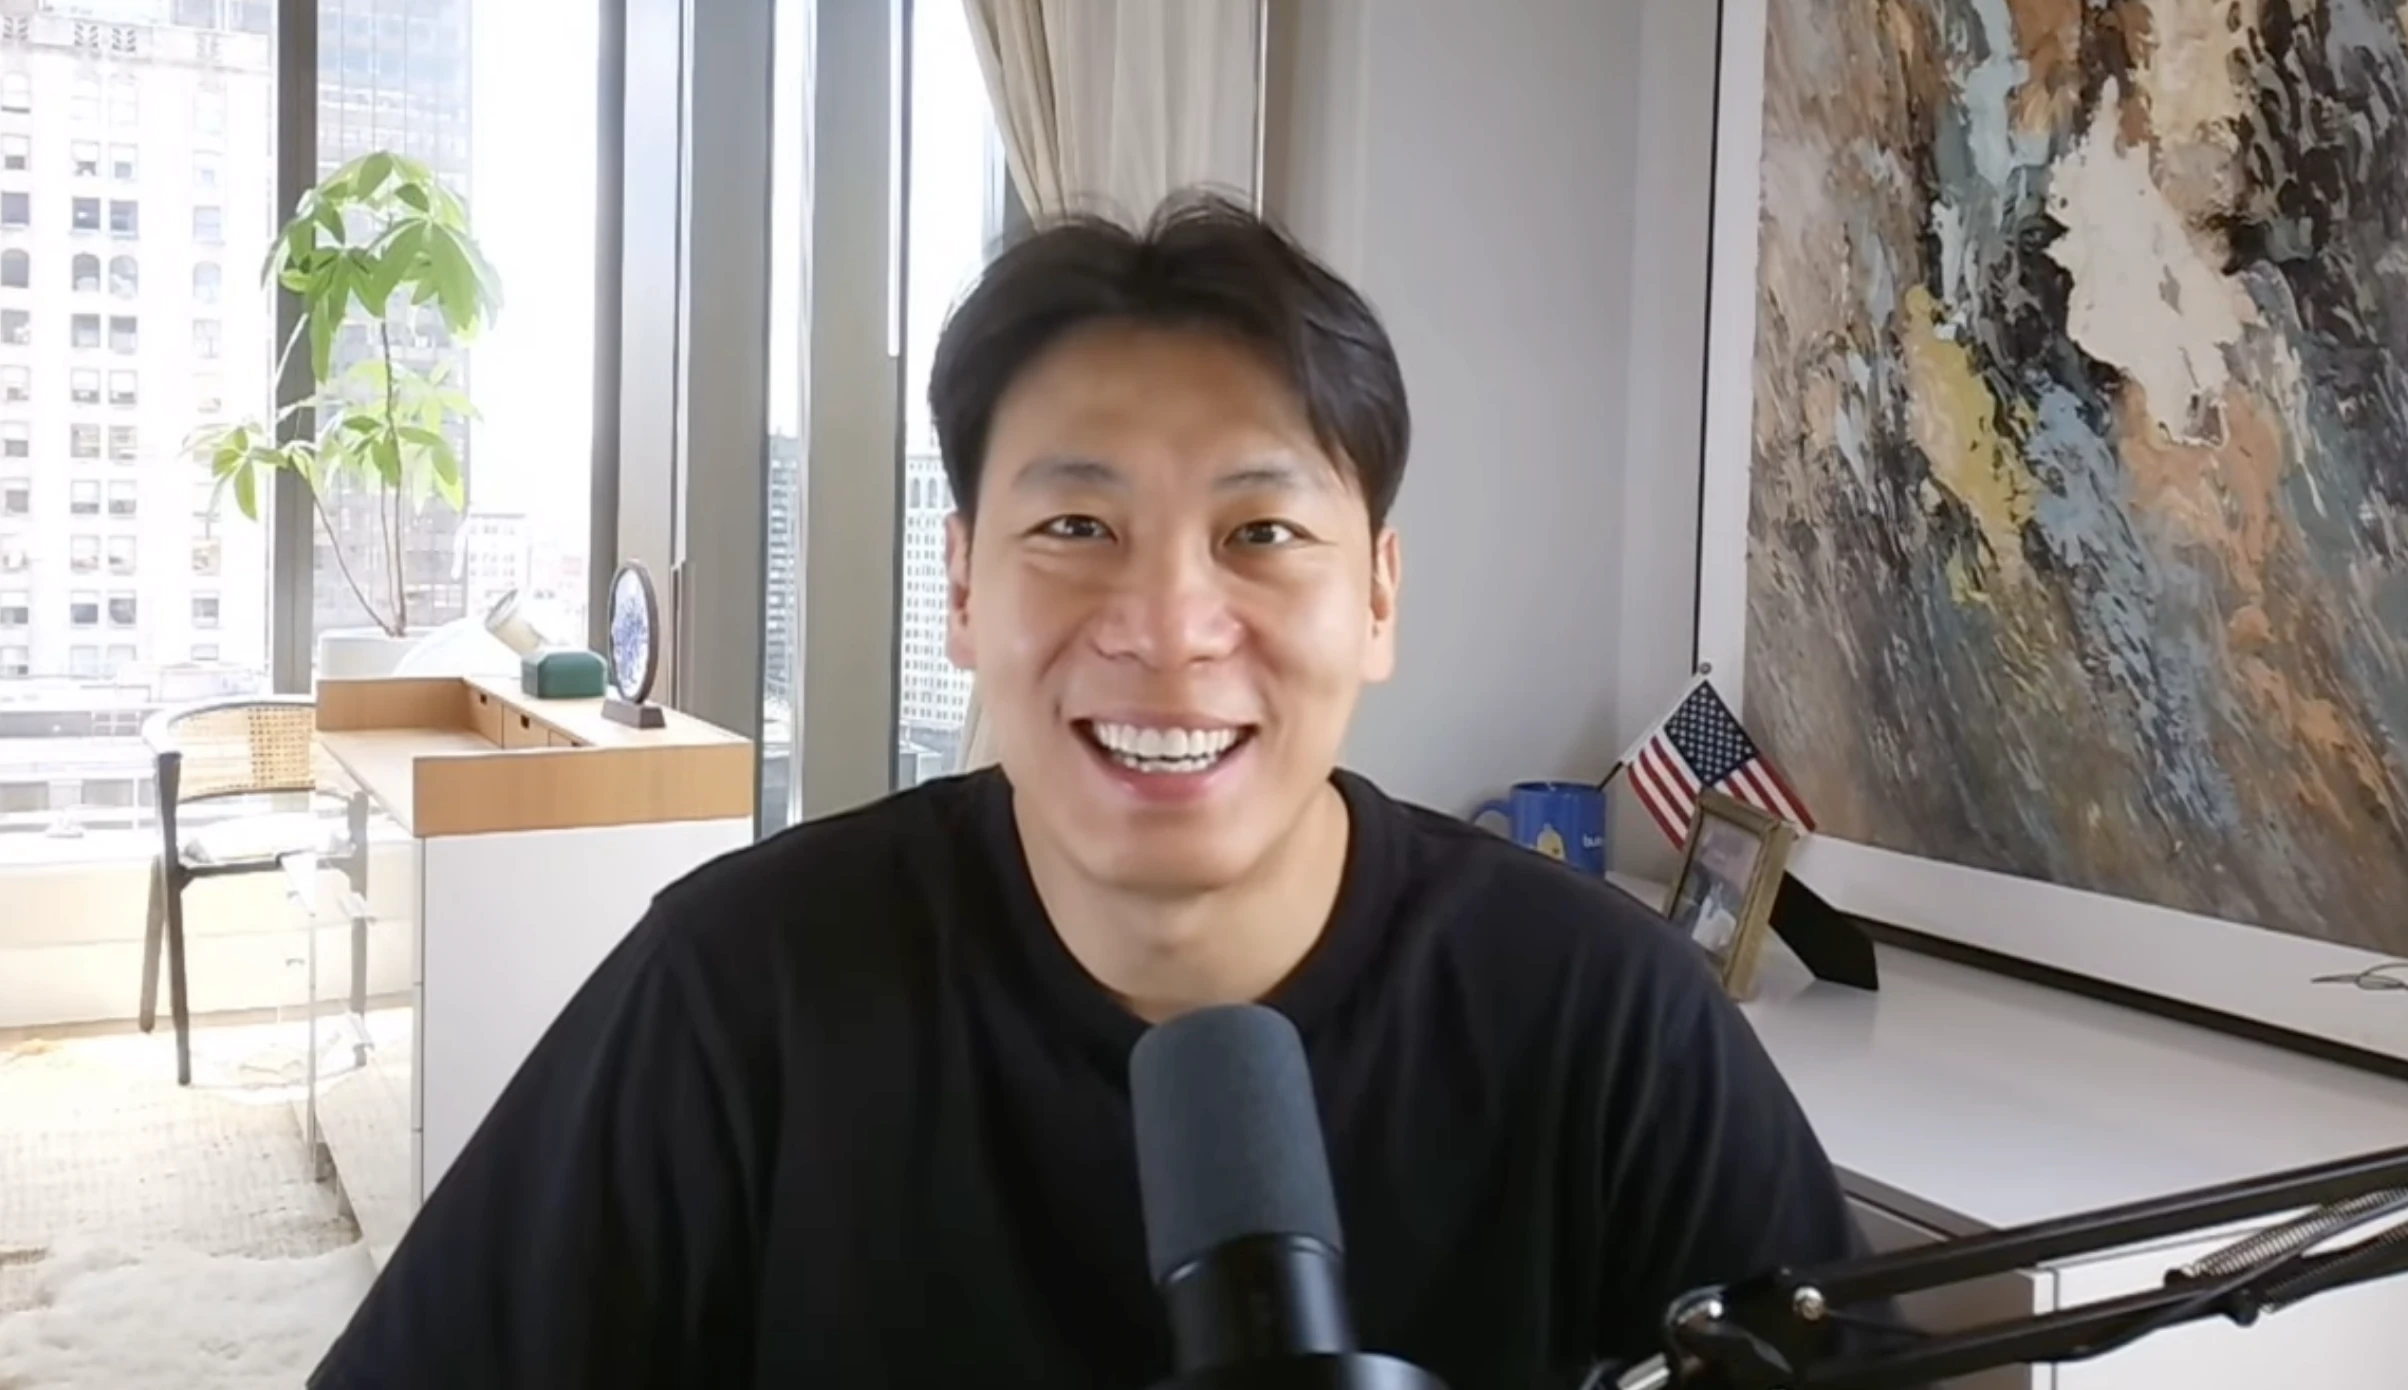
“I didn’t need another page of patterns. I needed to know which ones were worth my attention—and the data to back it up.”
Start free. No course upsells, no VIP-signals tier.
No card required
Includes
Billed monthly
vs technical and breakout screeners like TrendSpider ($51+/mo) and Finviz ($39.50/mo)
Everything in Free, plus:
Billed monthly
Everything in Premium, plus:
Secure checkout by Stripe · Apple Pay, Google Pay & cards
FAQ
We scan every night, and a breakout trade takes about five weeks to play out on average, so checking in once a day is enough.
Check my tickers for breakoutsFree with an account