What is backtesting?
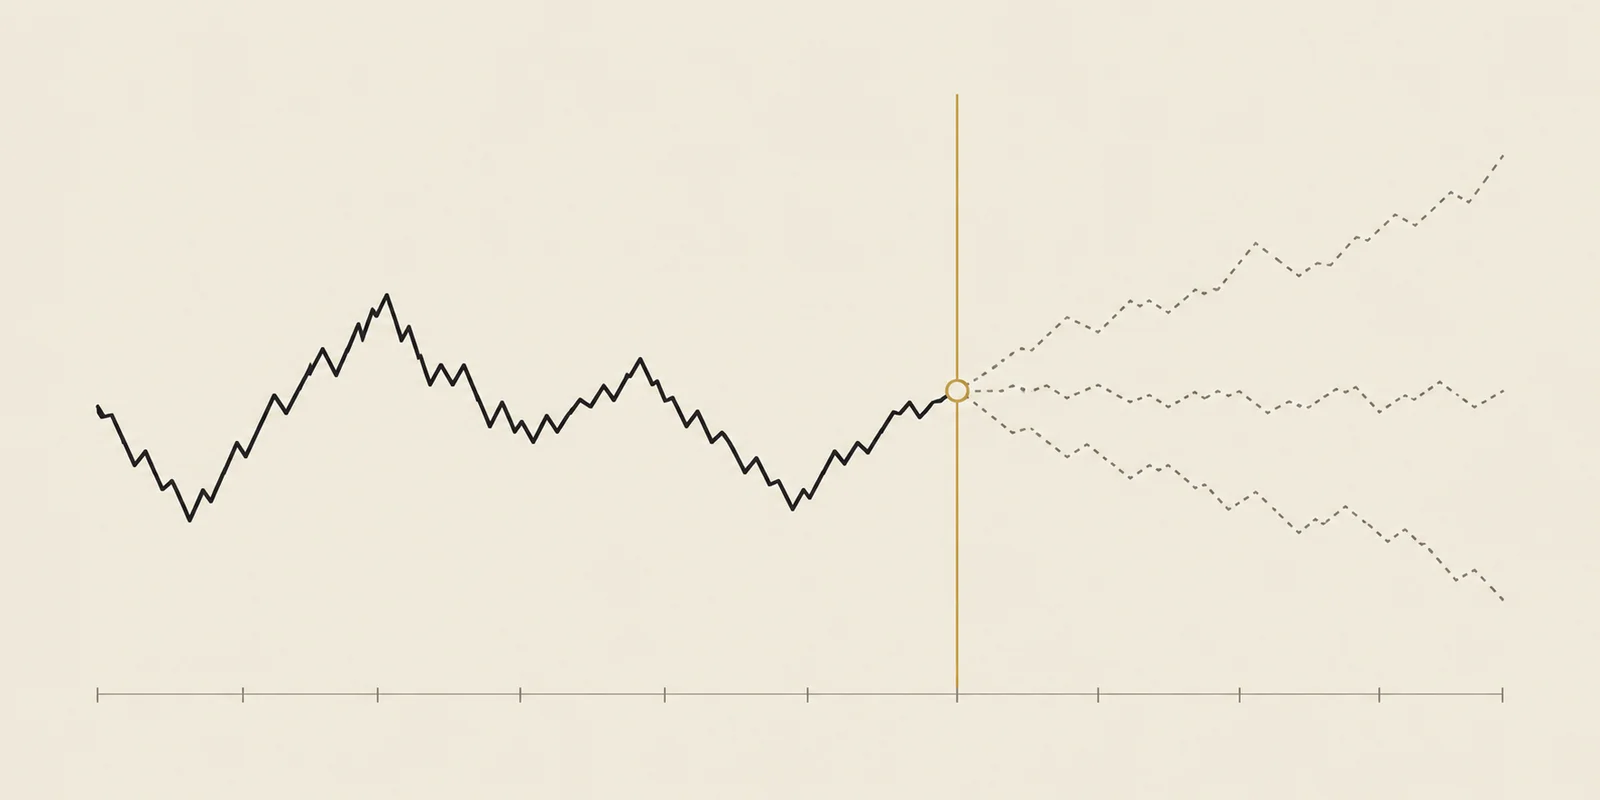
Backtesting applies a trading rule to historical prices and records the simulated outcomes.
Read the guide →
A setup’s trade history and an account’s return answer different questions. This guide follows the calculation from a historical signal to a limited-capital portfolio, including allocation, costs and the gaps between simulation and live trading.
Imagine ten setups reach their entry prices on the same day, but an account has room for only two. Counting all ten tells you how the setups performed. The account’s return depends on the two positions it actually took, their size and when their capital became available again.
TradingPal uses separate calculations for those questions. The historical engines below supply the trade records and account simulations. Paper and live measurement then compare those assumptions with actual fills.
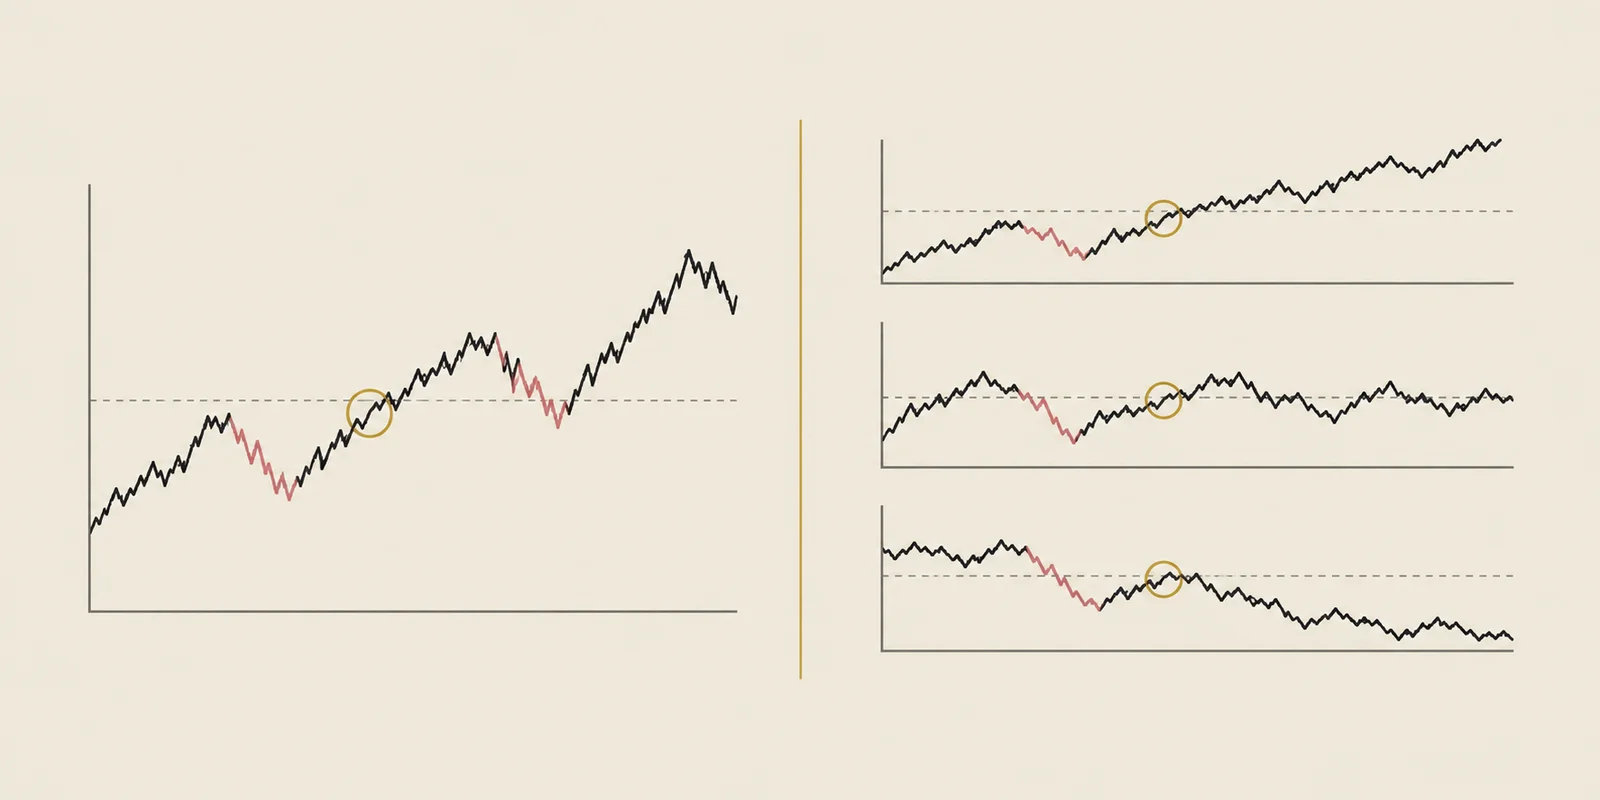
Each stage needs a rule that can be applied consistently. The introductory backtesting guide explains how hindsight and repeated tuning can distort a result; these are the checks used here.
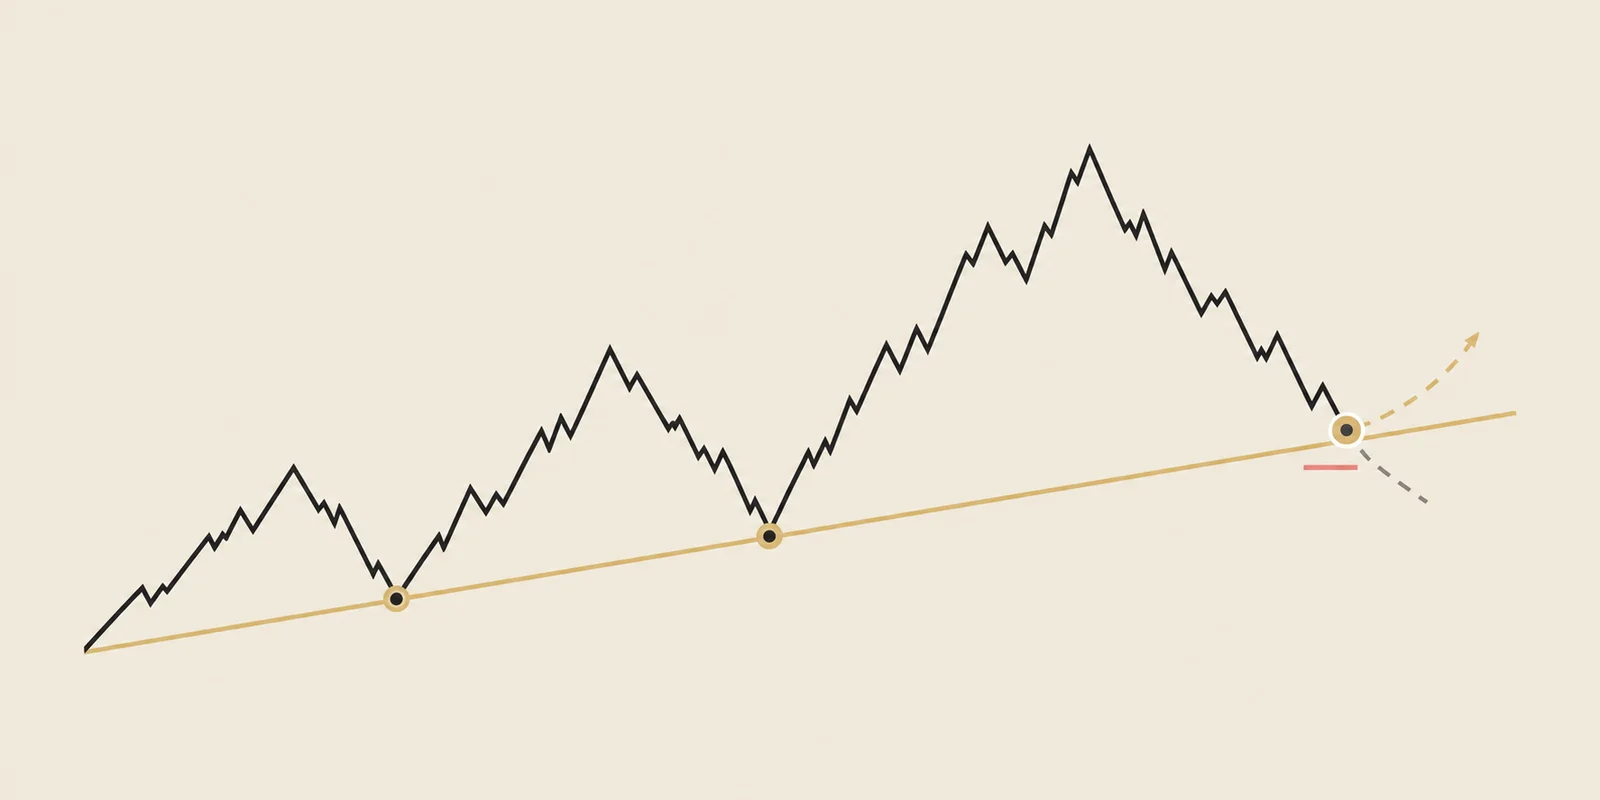
The support-and-resistance record belongs to the complete named setups. It includes the line, surrounding price context, entry, safety exit and target. Results for these rules cannot be assigned to every nearby line on a chart.
At each historical decision date, the calculation reconstructs the automatic lines for that window and checks whether the full setup qualifies. A weekly setup and a monthly setup use their respective chart intervals.
For filters evaluated on reserved data, candidate rules are specified before testing them on separate stocks or periods. The support and resistance guide introduces the chart concepts used in the trade rules.
A pattern trade begins only after the shape could be established on an earlier daily candle. The simulation then checks whether a later candle reaches the entry trigger beyond the boundary. This prevents a shape first identified after a move from receiving an entry at the start of that move.
Later confirmation is a separate limitation. The detector can use prices after the initial crossing to reject immediate failures, so the published sample contains patterns that ultimately passed those checks. It does not establish that each confirmed pattern was already known at the first crossing.
Setup-card accounts use the most recent 20-year window. They report the completed setup statistics separately from the return of positions the account could take. In the ten-signal example, all eligible completed signals contribute to the relevant trade statistics, while available cash and positions determine the account’s holdings.
Planned risk is measured from entry to the safety exit. The R-multiple guide shows how that distance determines position size.
Autopilot starts with stored historical pattern trades and moves through the calendar. It must choose among eligible signals while respecting available cash and a 16-position limit. Capital becomes available again when a position closes.
Candidate rankings use trades completed before the decision date, blending a stock’s own history with its pattern-family history. The displayed ranking does not establish the order in which prices reach their triggers. Daily data cannot identify the exact order of same-day crossings, so the account tests multiple allocation orders as described below.
The live selector also limits a position to 1% of the stock’s median dollar volume. The current public simulation does not model that additional liquidity cap, which can create differences in accepted trades and position size.
Return to the ten signals competing for two positions. Daily prices tell us which triggers were reached, but may not tell us which was reached first. Taking different pairs can change later cash availability and years of compounded returns.
TradingPal runs 25 reproducible allocation paths using different same-day orderings. Each uses the same historical market prices. The spread shows how sensitive the result is to those allocation choices.
The headline comes from one representative run. These repeated allocations test sensitivity within the existing sample; testing on reserved stocks or periods is a separate procedure.
Execution costs differ across the published records. Check the cost basis before comparing their returns.
Limits on price, liquidity and position size restrict the simulated trades, but they do not account for every expense or fill difference. Paper and live records provide a separate check on actual execution.
Start with trade results, then account growth and losses, and finally the amount of supporting data. The metrics guide provides worked examples. The available fields vary by surface.
The paper and live measurement layer matches real signals to the production pattern model. It compares the prices and results an account received with the simulated trade for the same setup.
A persistent difference in fill costs or trade outcomes can change the expected result. Small samples remain uncertain, so the reports include sample warnings as well as measures of divergence.
Pattern and support-and-resistance records update through the nightly process. The table below shows the latest completed published pattern result.
The public Autopilot record is rebuilt after strategy-affecting changes. Opening a page reads the published record; it does not run a new simulation.
| Pattern | Usual break | Win rate | Avg return | Backtested trades | Fresh (45d) |
|---|---|---|---|---|---|
| Bullish pennant | Up | 54.5% | +3.6% | 6,817 | 86 |
| Bearish pennant | Down | — | — | — | 0 |
| Ascending triangle | Up | 48.9% | +2.6% | 1,753 | 19 |
| Descending triangle | Down | 48.9% | +2.6% | 1,753 | 6 |
| Symmetrical triangle | Either way | 48.9% | +2.6% | 1,753 | 80 |
| Falling wedge | Up | 44.3% | +2.9% | 1,149 | 60 |
| Rising wedge | Down | 52.0% | +1.6% | 390 | 9 |
Historical results of a simulated strategy, refreshed nightly. Triangle rows show their usual break direction's family; each guide breaks out both directions.
The ten-signal example shows why a collection of attractive trades may produce a different account result. Limited capital and uncertain entry ordering explain part of that gap. The assumptions below account for other differences that remain.
Use these limits when deciding what the record can support. A historical gain describes the stated rules and data; changes in markets, execution or the available stock universe can produce a different result.
Because they answer different questions. The support-and-resistance engine tests named setups, the pattern engine tests wedges, pennants, and triangles, and the Autopilot backtest measures how one constrained account chooses among eligible pattern trades.
Breakouts that cross on the same day compete for scarce portfolio slots, and daily data does not say which crossed first. TradingPal runs 25 reproducible allocation paths and publishes one actual representative path: median ending value for setup cards and a fixed, previously selected path for Autopilot. It is a path-sensitivity check, not 25 independent market samples.
No. It is a 95% gross-exposure cap: the total entry notional cannot exceed 95% of equity, so there is no leverage and roughly 5% remains uncommitted. Planned loss risk is much smaller: about 1% per trade on setup cards and 0.65% in the current Autopilot policy, before caps can size it down.
Pattern and support-and-resistance cards remain before brokerage friction. The public Autopilot record models liquidity- and size-dependent costs at entry and exit, using a 25-basis-point round-trip reference. It does not separately charge commissions, short borrow or taxes. Actual execution may differ; no synthetic failed-entry losses are included.
A single setup-family card uses about 1% risk to show that edge in a constrained account. The current Autopilot policy spreads risk across a wider 16-position book; its validated setting is 0.65% per position. The two simulations share core caps but are not identical portfolios.
No. They test sensitivity to allocation order inside the same historical sample. Held-out validation is a separate research discipline used where a rule or gate is tuned under a frozen protocol.
Realized max drawdown is the worst dip on the representative historical path. Bootstrap p95 drawdown samples observed trade blocks with replacement to build many synthetic paths, then reports a stress threshold that about 95% stayed below. Autopilot's settled-equity drawdown can still miss deeper moves inside open trades.
Pattern and support-and-resistance results update through the nightly process. The public Autopilot record is rebuilt after strategy-affecting updates and served from storage; opening a page never starts a backtest.
Backtesting applies a trading rule to historical prices and records the simulated outcomes.
A track record describes trade outcomes, account growth and the losses along the way.
A trade’s entry, safety exit and target let you compare its planned loss with its potential gain.
The Support trendlines strategy uses a planned entry above a qualifying support line on weekly or monthly charts.
Educational content, not investment advice. Backtest statistics are historical results of a simulated strategy. Publication timing varies by record; the numbers describe the past, not the next trade.