A trading idea, tested
Does a flagpole make a triangle a better trade?
A sharp move before a triangle makes the momentum story more convincing. We tested whether it also made the trade better.

The short answer
A sharp move before the triangle did not identify better-paying trades in this sample. Triangles without a flagpole had higher win rates and average payoffs in both directions. That challenges the reason for requiring a pole, but does not prove poles hurt performance.
18,731 historical simulated symmetrical-triangle trades · 9,238 upward and 9,493 downward. Study recorded .Why would a flagpole matter?
Imagine a stock making a sharp rise, then moving up and down inside a small triangle. That fast rise is called the flagpole. The pause after it is a pennant. The story is appealing: buyers showed strength, took a breath, and may be ready to push the price higher again.
A symmetrical triangle can also form without a sharp preceding move. Its highs still fall and its lows still rise. It offers a narrowing range to watch, but not the same story about an earlier burst of momentum.
Illustrative · how the idea works
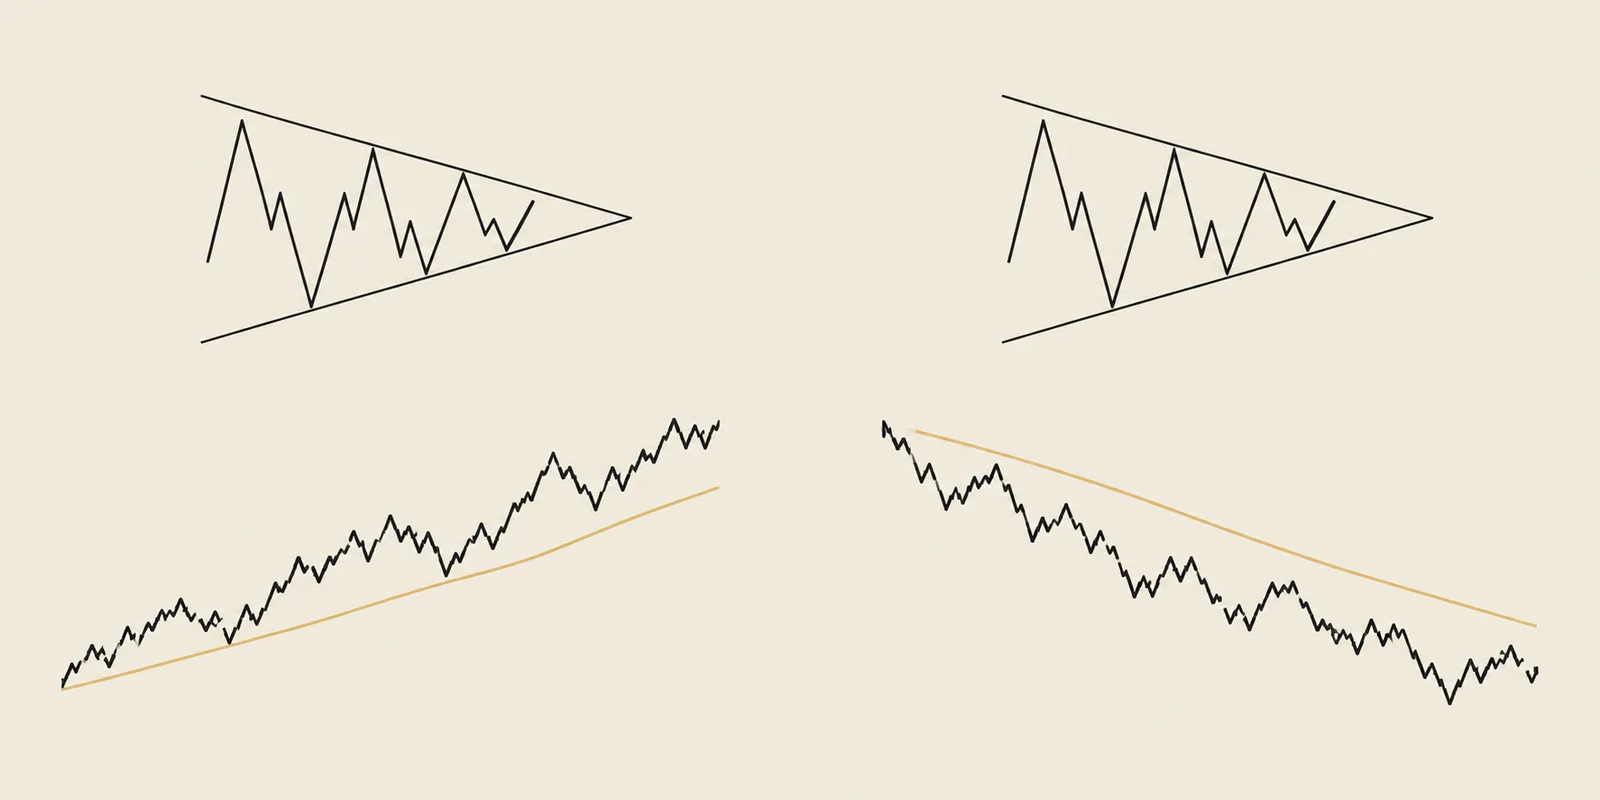
Same narrowing idea, different lead-in
Without a flagpole
With an upward flagpole
If the flagpole identifies stronger continuation opportunities, we would hope to see better results in triangles that have one. We asked whether the historical trades supported that extra requirement. For downward trades, the corresponding story is a sharp fall, a pause, and a possible continuation lower.
We separated the triangles by what came before them
We took the symmetrical-triangle trades from a historical daily-chart replay and applied the saved flagpole test. One group had a substantial preceding move; the other did not. We compared upward trades with upward trades and downward trades with downward trades.
Illustrative · how the idea works
Compare within each direction
Upward trades
Downward trades
There were 9,238 upward trades and 9,493 downward trades in these four groups. The wider source report also discussed other pattern families. Those other patterns are excluded from every result in this article.
We looked at how often trades won and how much they earned relative to their original planned risk. Suppose an illustrative purchase is $50 and its safety-exit reference is $48. The $2 difference is the planned risk per share; a $2 gain is 1R. This puts trades in differently priced stocks on the same risk scale.
Illustrative · how the idea works
Compare the reward with the risk you planned
The saved report contains the group counts and rounded summary results. We did not recover its original trade-by-trade file for this edition. That limits our ability to repeat the classification, examine unusual trades or calculate how uncertain the differences are.
What happened?
Requiring a flagpole did not improve either direction in the saved results. The upward group without a pole won more often and earned more for its planned risk. The downward groups showed smaller differences in the same direction. These are comparisons of different historical trades, not proof that removing a pole would improve a particular setup.
Source: TradingPal’s July 15, 2026 flagpole comparison. This article preserves the recorded summary precision for symmetrical triangles only. Original individual trade rows were not recovered for this edition.
Source: TradingPal’s July 15, 2026 flagpole comparison. This article preserves the recorded summary precision for symmetrical triangles only. Original individual trade rows were not recovered for this edition.
See the exact figures and download the table
| Group | Average result | Winning trades | Trades | Profit factor on equal planned risk |
|---|---|---|---|---|
| Without a flagpole | 0.628R | 60.3% | 7,869 | 2.27× |
| With a flagpole | 0.504R | 56% | 1,369 | 1.91× |
Average profit per trade for each $100 of original planned risk, including losing trades, before costs. This is not a return on $100 invested or an account growth rate.
| Group | Average result | Winning trades | Trades | Profit factor on equal planned risk |
|---|---|---|---|---|
| Without a flagpole | 0.188R | 47.5% | 7,604 | 1.27× |
| With a flagpole | 0.168R | 44.3% | 1,889 | 1.22× |
Average profit per trade for each $100 of original planned risk, including losing trades, before costs. This is not a return on $100 invested or an account growth rate.
Source: TradingPal’s July 15, 2026 flagpole comparison. This article preserves the recorded summary precision for symmetrical triangles only. Original individual trade rows were not recovered for this edition.
Download summary results (CSV) ↓The momentum story did not earn its extra rule
Among upward trades, triangles without a pole won 60.3% of the time, compared with 56.0% for those with one. Their average result was about $62.80 per trade for each $100 of planned risk, versus $50.40 with a pole. Both averages include losing trades and are before costs.
The downward comparison also favored the no-pole group, but by less: $18.80 versus $16.80 per trade for each $100 of planned risk. Win rates were 47.5% and 44.3%. These figures measure the trades after entry; they do not tell you how likely an unfinished triangle is to break downward.
Return to the two drawings. The pennant gives you an intuitive account of what happened before the pause. In this test, that story did not identify a group with better results. The plain triangle did not need a dramatic preceding move to produce a positive average simulated payoff.
That is a reason to question a rule that automatically rejects triangles without a pole. It is not evidence that a pole causes worse trades, or that every plain triangle is worth trading. The groups had different stocks, dates and sizes, and the smaller differences could be due to chance.
The historical pole test was also reconstructed from saved trade geometry rather than the exact inputs used at detection. Borderline patterns could change groups. A new rule favoring one group would need a cleaner follow-up test on genuinely unseen trades, plus a portfolio simulation with costs.
What this study cannot tell us
This historical comparison did not support requiring a flagpole. It also cannot prove the groups differ reliably: the report preserves rounded summaries, the original trade rows were not recovered, and the after-the-fact pole classification has known boundary cases.
Read all study limitations
- These are historical simulations, not live investment returns or independently reviewed academic papers. Several trades share stocks and market periods, so the observations are not independent.
- Historical pattern confirmation can use information learned later. The available universe also underrepresents failed and delisted companies. These results do not establish performance on genuinely unseen data.
- Trading costs, slippage, stock-borrow fees and portfolio capacity are not deducted here. Daily bars cannot reproduce every intraday fill. A safety exit can lose more than the amount originally planned.
- The flagpole groups were smaller than the no-pole groups. No confidence intervals or independent follow-up establish whether the observed differences are distinguishable from chance.
- Pole classification was reconstructed after the historical replay using trade geometry; borderline cases can differ from classification at detection.
- Exact history endpoints and original individual trade rows were not recovered. Do not combine these July 15 figures with the separate July 16 ledger used for the market-context article.
For readers who want to check the work
How the study was done, sources and download
- Source and date
- Research log: 2026-07-15_pennant-flagpole-cohort-split.md. Original full-universe replay covered 628 symbols and generated 76,624 trades before filtering. This article reports only the four symmetrical-triangle groups.
- Selection
- Drop skipped trades; remove overlaps across the full ledger, including wedge families, before grouping. Apply the recorded 0.3% minimum entry-risk floor and pennant_aware stop model.
- Pole classification
- Run _has_substantial_pole on symmetrical_triangle trades using pattern_start_index and pattern_end_index, with height from _pattern_high_low_height_pct. Detection used gap_start_idx for its height inputs; this reconstruction is not byte-identical and can differ at the boundary.
- Comparison
- Upward: 7,869 without a pole and 1,369 with one. Downward: 7,604 without a pole and 1,889 with one. Ascending/descending triangles, squeezes and wedges are excluded from the displayed results.
- Metrics
- Win rate counts positive completed outcomes. Mean R averages profit or loss divided by original planned risk. Profit factor divides total positive R by the absolute total negative R. All figures retain the saved summary precision; counts of wins are not reconstructed from rounded rates.
- History and execution
- Daily charts using the history available per symbol at the July 15, 2026 replay. Exact first and last trade dates and a cost-adjusted portfolio result were not retained in the source summary. Cached detection payloads were used; detection determinism was not reverified.
- Available evidence
- Dated internal methodology and summary table. The original observation rows and session-local analysis script were not recovered for this publication. The CSV is a summary-table download, not an independent rerun.
Source: TradingPal’s July 15, 2026 flagpole comparison. This article preserves the recorded summary precision for symmetrical triangles only. Original individual trade rows were not recovered for this edition.
Download methods and limitations (text) ↓Cite this research
Use the article link so readers can see the comparison and its limitations. Describe these as historical simulated results, naming the comparison and its scope. The figures do not predict future returns.
TradingPal Research (2026-09-22). Does a flagpole make a triangle a better trade? Version 1.0. Historical study recorded 2026-07-15. https://tradingpal.io/learn/research/triangle-flagpole-study
Questions about the research? Contact TradingPal Research.
Publication and revision record
Version 1.0 · September 22, 2026. First article edition of the study recorded July 15, 2026. The report uses fixed figures; nightly product updates do not change them. Corrections will be dated and explained here.
Keep learning
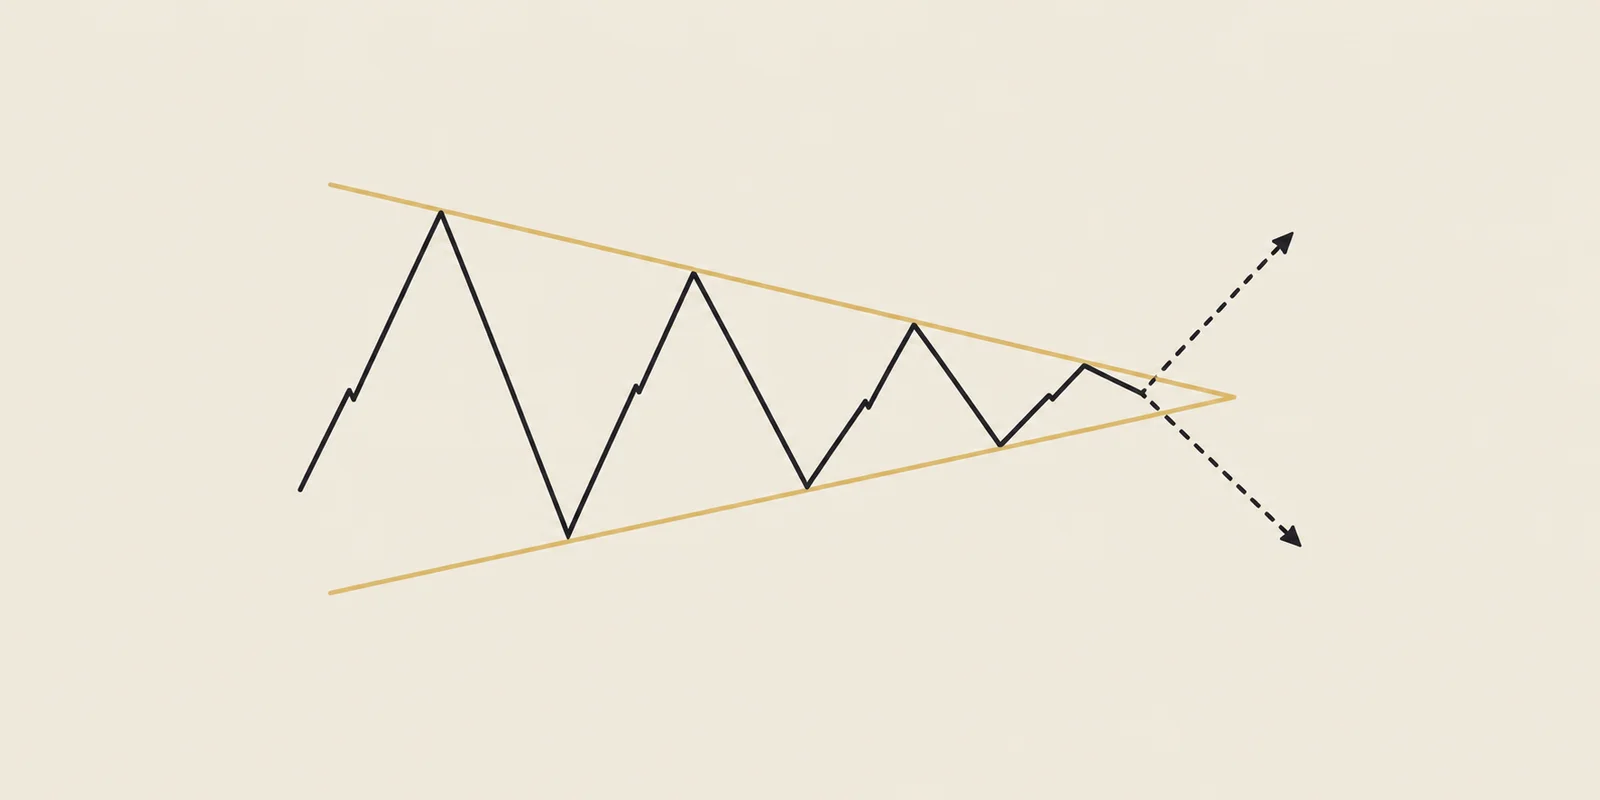
Symmetrical triangle
The swings get smaller, but the next move can go either way.

Bullish pennant
A bullish pennant forms when a sharp rally pauses in a small, narrowing range.
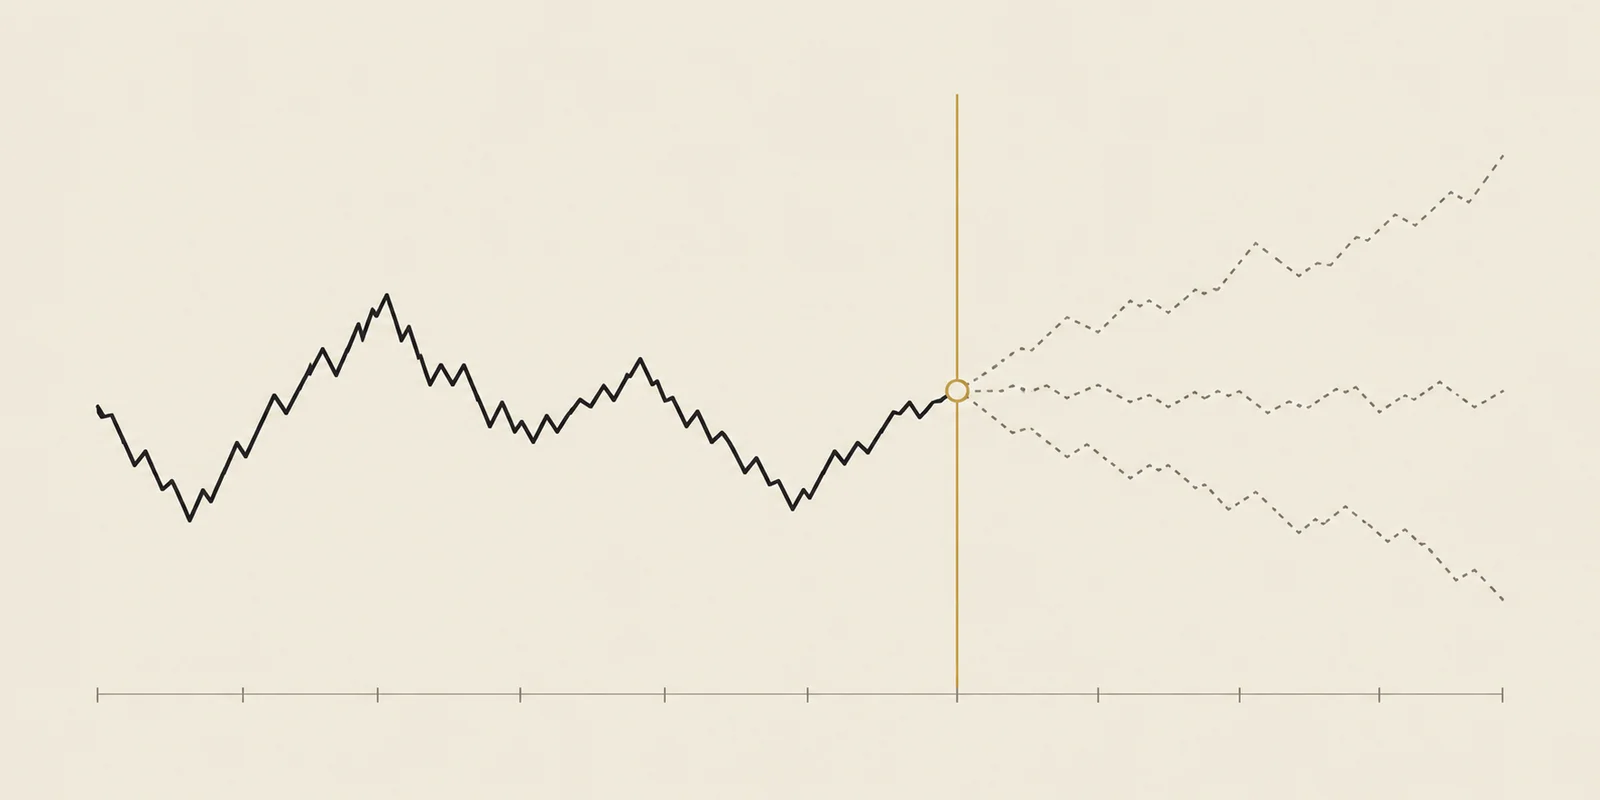
What is backtesting?
Backtesting applies a trading rule to historical prices and records the simulated outcomes.
Another question we tested
Original research ·
Does the market change a triangle breakout’s odds?
Upward trades won more often above the market average; downward trades earned more for their risk below it.
Read the study
Original research ·
Do more touches make a bullish pennant a better trade?
Extra touches did not improve the average trade. The four-touch group came out ahead.
Read the studyEducational research, not investment advice. Historical observations do not predict the next trade. TradingPal publishes this research and sells trading software.