A trading idea, tested
Does the market change a triangle breakout’s odds?
The same triangle can appear in very different markets. We checked whether the surrounding market was associated with different trade results.
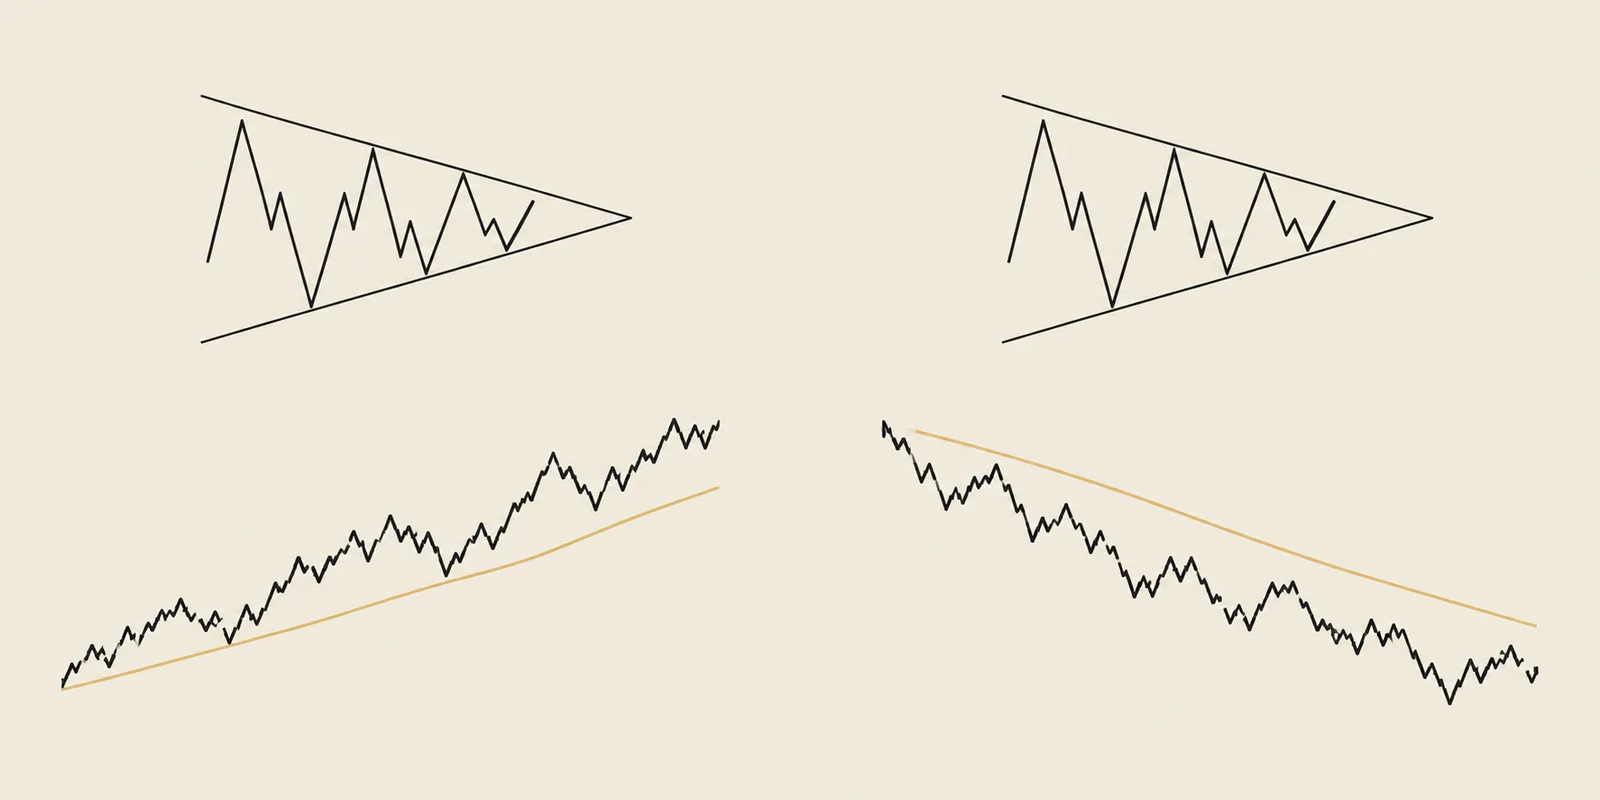
The short answer
The wider market was associated with different triangle results. Upward trades won more often above the market’s long-term average. Downward trades earned more for their planned risk below it. Cropping a chart down to the triangle leaves out information that mattered in this historical sample.
12,360 completed daily-chart symmetrical-triangle trades across 573 symbols · entries from 2000 through July 16, 2026. Study recorded .The triangle is only part of the picture
Imagine a stock moving between lower highs and higher lows. The swings shrink into a triangle. If it breaks upward, a trader can buy and aim to sell higher. If it breaks downward, a trader can sell borrowed shares and aim to buy them back lower. That second approach is a short trade.
Now pull back from the stock. Is the wider market holding up, or has it been struggling? It is plausible that buying a breakout during broad market strength could work differently from buying one during weakness. The reverse might matter for a downward trade. Those are ideas to check, not explanations we can assume are true.
We used SPY, a fund that tracks the S&P 500, as our market reference. We compared its closing price with its 200-day moving average: the average of its last 200 daily closes. A close at or above that line went into one group; a close below it went into the other.
Illustrative · how the idea works
Put the market beside the stock
Close above the average
Dark: market price
Gold: 200-day average
Close below the average
Dot: last completed close
The group is set before entry
The line is a consistent way to sort the history. It does not mean every day above it rises, or every day below it falls. A stock can also move against the wider market.
We checked the market before each trade began
For every trade, we used the last completed SPY session before entry. That keeps the classification from changing after we see whether the trade wins. A trade that starts with SPY above its average stays in that group, even if the market falls later.
Illustrative · how the idea works
Classify first, then observe the trade
We isolated symmetrical triangles, including those with and without a sharp preceding move. We left out ascending triangles, descending triangles, squeezes and wedges. Then we compared above-average and below-average markets separately for upward and downward trades.
We counted 12,360 completed simulated trades across 573 symbols. Entries fell between January 1, 2000 and July 16, 2026. The two market groups contain different trades, stocks and dates; the drawings illustrate the categories, not a pair of otherwise identical historical trades.
To compare payoffs, we measured each gain or loss against what that trade originally planned to risk. Buying at $50 with a safety-exit reference at $48 puts $2 a share at planned risk. A $2 gain equals 1 unit of that risk, written as 1R. We then express the average on a $100 planned-risk scale so the dollar figures have a common meaning.
Illustrative · how the idea works
Compare the reward with the risk you planned
What happened?
The differences depended on the direction of the trade. Upward trades won more often in the above-average market group. Downward trades earned nearly twice as much per unit of planned risk in the below-average group, even though their win rates were much closer. The charts include losses and compare the same amount of planned risk.
Source: TradingPal’s triangle-only market-context analysis recorded September 21, 2026, using the preserved July 16, 2026 trade ledger and prior-session SPY closes. Figures are fixed for this article; they are separate from the changing product record.
Source: TradingPal’s triangle-only market-context analysis recorded September 21, 2026, using the preserved July 16, 2026 trade ledger and prior-session SPY closes. Figures are fixed for this article; they are separate from the changing product record.
See the exact figures and download the table
| Group | Average result | Winning trades | Trades | Average price-based trade payoff | Profit factor on equal planned risk |
|---|---|---|---|---|---|
| SPY at or above its 200-day average | 0.6483384797605556R | 62.11573236889693% | 4,424 | 3.1187871201473416% | 2.3714693128778688× |
| SPY below its 200-day average | 0.35501372511263524R | 52.93141592920354% | 1,808 | 2.373117902547156% | 1.60929207066743× |
Average profit per trade for each $100 of original planned risk, including losing trades, before costs. This is not a return on $100 invested or an account growth rate.
| Group | Average result | Winning trades | Trades | Average price-based trade payoff | Profit factor on equal planned risk |
|---|---|---|---|---|---|
| SPY at or above its 200-day average | 0.13554842542831216R | 45.94724220623501% | 4,170 | 0.48936461852416446% | 1.1899713162711054× |
| SPY below its 200-day average | 0.26687956987153705R | 48.825331971399386% | 1,958 | 1.4069068768612447% | 1.4095051926995104× |
Average profit per trade for each $100 of original planned risk, including losing trades, before costs. This is not a return on $100 invested or an account growth rate.
Source: TradingPal’s triangle-only market-context analysis recorded September 21, 2026, using the preserved July 16, 2026 trade ledger and prior-session SPY closes. Figures are fixed for this article; they are separate from the changing product record.
Download summary results (CSV) ↓Different payoffs, not just different win rates
Upward trades won 62.1% of the time with SPY at or above its average, compared with 52.9% below it. The average payoff was also larger: about $64.83 versus $35.50 per trade for each $100 of planned risk, including the losses.
For downward trades, the win rates were closer: 45.9% above the average and 48.8% below. But the average payoff rose from $13.55 to $26.69 per trade for each $100 of planned risk. That is nearly 2 times as much reward for the same planned risk. The chance of winning did not double.
A group can win fewer than half its trades and still finish ahead if its wins are large enough to cover its losses. The averages here include both. They describe completed trades before costs, not the percentage growth of a trading account.
Return to the triangle on your stock chart. The drawing still helps describe where the trade might begin. This comparison adds a reason to check the surrounding market before treating every similar drawing as the same opportunity.
It does not establish that turning the market reference into a trading filter would improve annual portfolio growth. A filter changes which trades use the account’s money and when that money is available. That needs a separate portfolio simulation. Different stocks, dates and volatility could also help explain the gaps we observed.
What this study cannot tell us
The comparison shows an association in past simulated trades. It does not isolate the market as the cause, remove hindsight from historical pattern selection, or establish the return of an account using a market filter.
Read all study limitations
- These are historical simulations, not live investment returns or independently reviewed academic papers. Several trades share stocks and market periods, so the observations are not independent.
- Historical pattern confirmation can use information learned later. The available universe also underrepresents failed and delisted companies. These results do not establish performance on genuinely unseen data.
- Trading costs, slippage, stock-borrow fees and portfolio capacity are not deducted here. Daily bars cannot reproduce every intraday fill. A safety exit can lose more than the amount originally planned.
- This is one observational comparison. Market groups differ in dates, stocks, volatility and trade frequency. No confidence interval, independent holdout or causal effect is established here.
- The market study uses a different ledger and selection from the July 15 flagpole report. Their counts and rates must not be pooled.
For readers who want to check the work
How the study was done, sources and download
- Frozen source
- July 16, 2026 ledger, generated 2026-07-16T20:36:26.451077. SHA-256: e0d48452b9513c316932df99643c88a22437c466c996b812b45e46422f4abb91. Analysis recorded September 21, 2026.
- Selection
- Remove skipped rows. Deduplicate overlapping trades across all pattern families before selecting symmetrical triangles; unresolved trades reserve their occupied intervals. Keep completed trades with entry dates from 2000-01-01 through 2026-07-16 and planned risk of at least 0.3% of entry price.
- Population
- 12,360 completed symmetrical-triangle trades across 573 symbols, including patterns with and without flagpoles. No ascending/descending triangles, squeezes or wedges in the reported results.
- Market rule
- Prior-session SPY close at or above the 200-session simple moving average versus below it. The average includes that prior close and 199 preceding closes. All selected trades had market coverage.
- Payoff and units
- Mean R weights each trade equally after dividing its profit or loss by original planned risk. Charts multiply mean R by $100. The separate price-based payoff is the mean directional price change from each entry; for shorts, a price decline is a positive payoff. Neither is an account return.
- Profit factor
- Sum of positive R outcomes divided by the absolute sum of negative R outcomes: equal planned risk. It is not the ratio of the average win to the average loss.
- Portfolio and costs
- No portfolio slot limits, capital allocation, extra 2.5% portfolio risk floor, fees or borrowing costs. No market-filtered CAGR was calculated in this comparison.
- Recheckable evidence
- Preserved source ledger, classified trade rows, SPY closes and comparison script were available for this analysis. SPY snapshot SHA-256: 876d72efd070371cdfd7528f8e0f14ea3dc1eb9e6656bdaa2cb257187cea5408. The download contains group summaries, not individual trade rows.
Source: TradingPal’s triangle-only market-context analysis recorded September 21, 2026, using the preserved July 16, 2026 trade ledger and prior-session SPY closes. Figures are fixed for this article; they are separate from the changing product record.
Download methods and limitations (text) ↓Cite this research
Use the article link so readers can see the comparison and its limitations. Describe these as historical simulated results, naming the comparison and its scope. The figures do not predict future returns.
TradingPal Research (2026-09-22). Does the market change a triangle breakout’s odds? Version 1.0. Historical study recorded 2026-09-21. https://tradingpal.io/learn/research/triangle-market-context-study
Questions about the research? Contact TradingPal Research.
Publication and revision record
Version 1.0 · September 22, 2026. First article edition of the study recorded September 21, 2026. The report uses fixed figures; nightly product updates do not change them. Corrections will be dated and explained here.
Keep learning
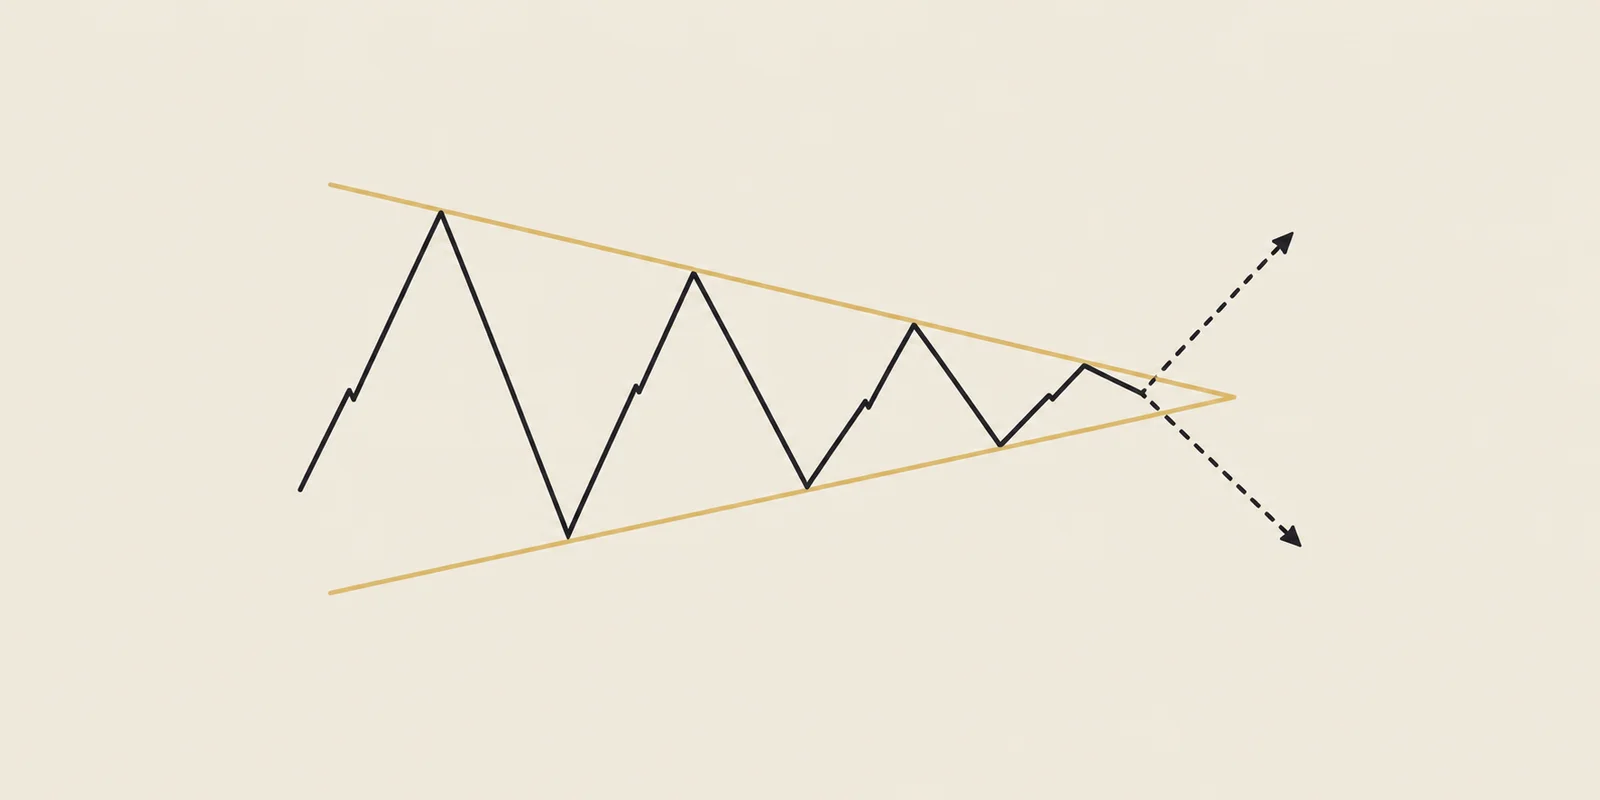
Symmetrical triangle
The swings get smaller, but the next move can go either way.

Track record metrics
A track record describes trade outcomes, account growth and the losses along the way.
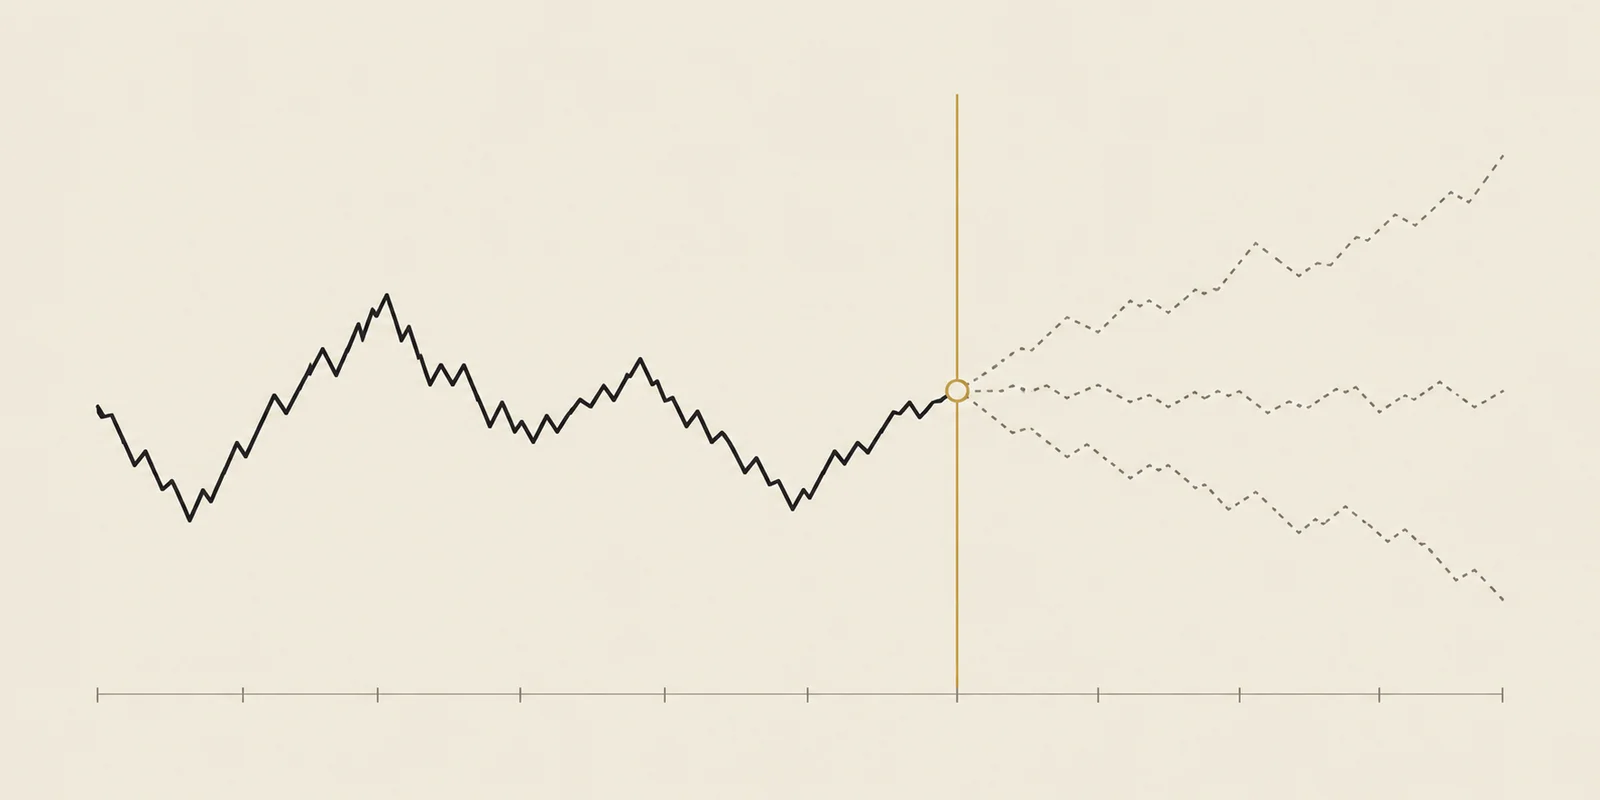
What is backtesting?
Backtesting applies a trading rule to historical prices and records the simulated outcomes.
Another question we tested

Original research ·
Does a flagpole make a triangle a better trade?
Requiring a flagpole did not improve win rates or average payoff in either direction in this historical sample.
Read the study
Original research ·
Do more touches make a bullish pennant a better trade?
Extra touches did not improve the average trade. The four-touch group came out ahead.
Read the studyEducational research, not investment advice. Historical observations do not predict the next trade. TradingPal publishes this research and sells trading software.