A trading idea, tested
Do more touches make a bullish pennant a better trade?
A pennant can look more convincing after a few extra bounces. We checked whether that cleaner-looking shape actually paid more.

The short answer
A pennant with more bounces can look more established. In this study, that did not make it a better-paying trade. The four-touch group had the highest average result, even though some higher-touch groups won more often.
Daily-chart bullish-pennant family · 9,057 historical simulated trades. Study recorded .Why do extra touches feel reassuring?
Imagine a stock rises quickly, then pauses. Its price starts bouncing between two lines that draw closer together. That small tightening pause is the pennant. A touch is a visit to one of its boundaries.
After four touches, you can already see the back-and-forth shape. After six, it may look more convincing: the price has respected the lines more times. It is easy to turn that visual confidence into an assumption that the trade must be better.
Illustrative · how the idea works
Count visits to the boundaries
Four touches
Six touches
We wanted to check that assumption. Did patterns with more touches actually produce better results once we counted both their winners and their losers?
We grouped the trades by how many times price touched a boundary
The audit used a saved set of historical simulated trades. After applying the existing rule for removing overlapping trades, we selected the bullish-pennant family and separated it into four groups: four touches, five or six, seven or eight, and nine or more.
These were different groups of trades. We did not take one four-touch setup and hold off buying it until two extra bounces appeared. That distinction matters: the result compares pattern types, rather than proving what waiting would do to the same trade.
To compare trades with different prices, we measured each result against its own planned risk. Suppose you plan to buy at $50 and use $48 as the safety-exit reference. The planned risk is $2 a share. A $2 profit is one unit of risk, called 1R; a $1 profit is half a unit. Actual losses can exceed the planned amount.
Illustrative · how the idea works
Compare the reward with the risk you planned
That lets us put all the trades on a common scale. An average of 0.772R means about $77.20 per $100 of planned risk. It includes losses; it is not the size of the average winner or a return on the amount invested.
What happened?
The four-touch group averaged about $77 for every $100 of planned risk. The five-to-six-touch group averaged about $46. That is roughly 40% less. These are averages across winners and losers, expressed on the same risk scale—not returns on a $100 investment.
Source: TradingPal’s August 26, 2026 touch-count audit, used for the bullish pennant episode. The figures are the saved audit summary, separate from the episode’s overall scanner record.
See the exact figures and download the table
| Group | Average result | Winning trades | Trades |
|---|---|---|---|
| Four touches | 0.772R | 56.5% | 2,144 |
| Five or six touches | 0.462R | 56.5% | 1,868 |
| Seven or eight touches | 0.438R | 57.8% | 3,569 |
| Nine or more touches | 0.555R | 60.1% | 1,476 |
Each amount shows average simulated profit or loss for every $100 of original planned risk. It includes losing trades. Costs are not deducted.
Source: TradingPal’s August 26, 2026 touch-count audit, used for the bullish pennant episode. The figures are the saved audit summary, separate from the episode’s overall scanner record.
Download summary results (CSV) ↓A more convincing picture can still be a weaker-paying trade
The four-touch and five-to-six-touch groups won equally often in the saved summary. Yet the second group earned much less on average. A win count alone would have missed the difference.
The groups with seven or more touches won a little more often, but their average results were still below the four-touch group. They also did not get steadily worse as touches increased: the nine-or-more group recovered some of the gap. There is no simple “each extra touch costs this much” rule here.
Return to the chart you were watching. If it already meets the full pattern rules, more touches are not automatically a reason to trust it more. In this test, the extra visual reassurance did not come with a larger average payoff.
This does not make any four-contact drawing a valid trade. The shape, the earlier rise, the breakout, the planned exit and the information available at the time still matter. The finding challenges one assumption: more touches did not mean more money per trade in these historical groups.
What this study cannot tell us
This compares different historical groups, so other differences between the patterns could help explain the result. The original cache at the named path has since changed; this edition reports the saved audit table rather than claiming a fresh rerun of its original trades.
Read all study limitations
- These are historical simulations, not actual customer trades or papers reviewed by independent academic experts. Prices, trading costs and future market conditions can produce different results.
- Several trades can come from the same stock or the same market period. They are not independent coin flips. A large trade count does not turn one historical comparison into a promise about the future.
- The historical universe does not fully represent companies that failed or disappeared. Daily price summaries also cannot show every move within a trading session, and modeled entries or exits may be unavailable in practice.
- This is a separate historical trade-level study, not a breakdown of the video’s overall setup count or today’s scanner. The bullish-pennant family includes the related consolidation shapes grouped with it by the research system.
- No new portfolio replay, cost adjustment or independent statistical validation is claimed. Removing overlapping trades does not remove every dependence between observations.
For readers who want to check the work
How the study was done, sources and download
- Population
- 9,057 retained bullish-pennant-family trades from a v62 cache generated August 21, 2026. The audit names 1,416 symbols and 48,130 all-family source rows. Exact first and last trade dates are not recorded in the audit.
- Overlap rule
- Across all families, group by symbol and direction, sort by entry, keep the first trade in an overlapping holding-window cluster, and prefer more touches on same-day ties; then select the bullish-pennant family.
- Metric
- Mean original-risk R includes wins and losses. Chart dollar labels multiply the recorded R by 100 solely for explanation. The 40% comparison uses 0.462 versus 0.772.
- Evidence retained
- August 26 audit summary and final episode transcript. The original source cache hash is 1c0d2b4df761d519a05ed218f633837d9b226415c787b89c2a0a5b0434b8b7a2; the current file at that path has a different hash and was not substituted.
Source: TradingPal’s August 26, 2026 touch-count audit, used for the bullish pennant episode. The figures are the saved audit summary, separate from the episode’s overall scanner record.
Watch the bullish pennant episode →
Download methods and limitations (text) ↓Cite this research
Use the article link so readers can see the comparison and its limitations. Describe these as historical simulated results, naming the comparison and its scope. The figures do not predict future returns.
TradingPal Research (2026-09-10). Do more touches make a bullish pennant a better trade? Version 1.0. Historical study recorded 2026-08-26. https://tradingpal.io/learn/research/pennant-touch-count-study
Questions about the research? Contact TradingPal Research.
Publication and revision record
Version 1.0 · September 10, 2026. First article edition of the study recorded August 26, 2026. The report uses fixed figures; nightly product updates do not change them. Corrections will be dated and explained here.
Keep learning

Bullish pennant
A bullish pennant forms when a sharp rally pauses in a small, narrowing range.

Risk/reward & R-multiples
A trade’s entry, safety exit and target let you compare its planned loss with its potential gain.
What is backtesting?
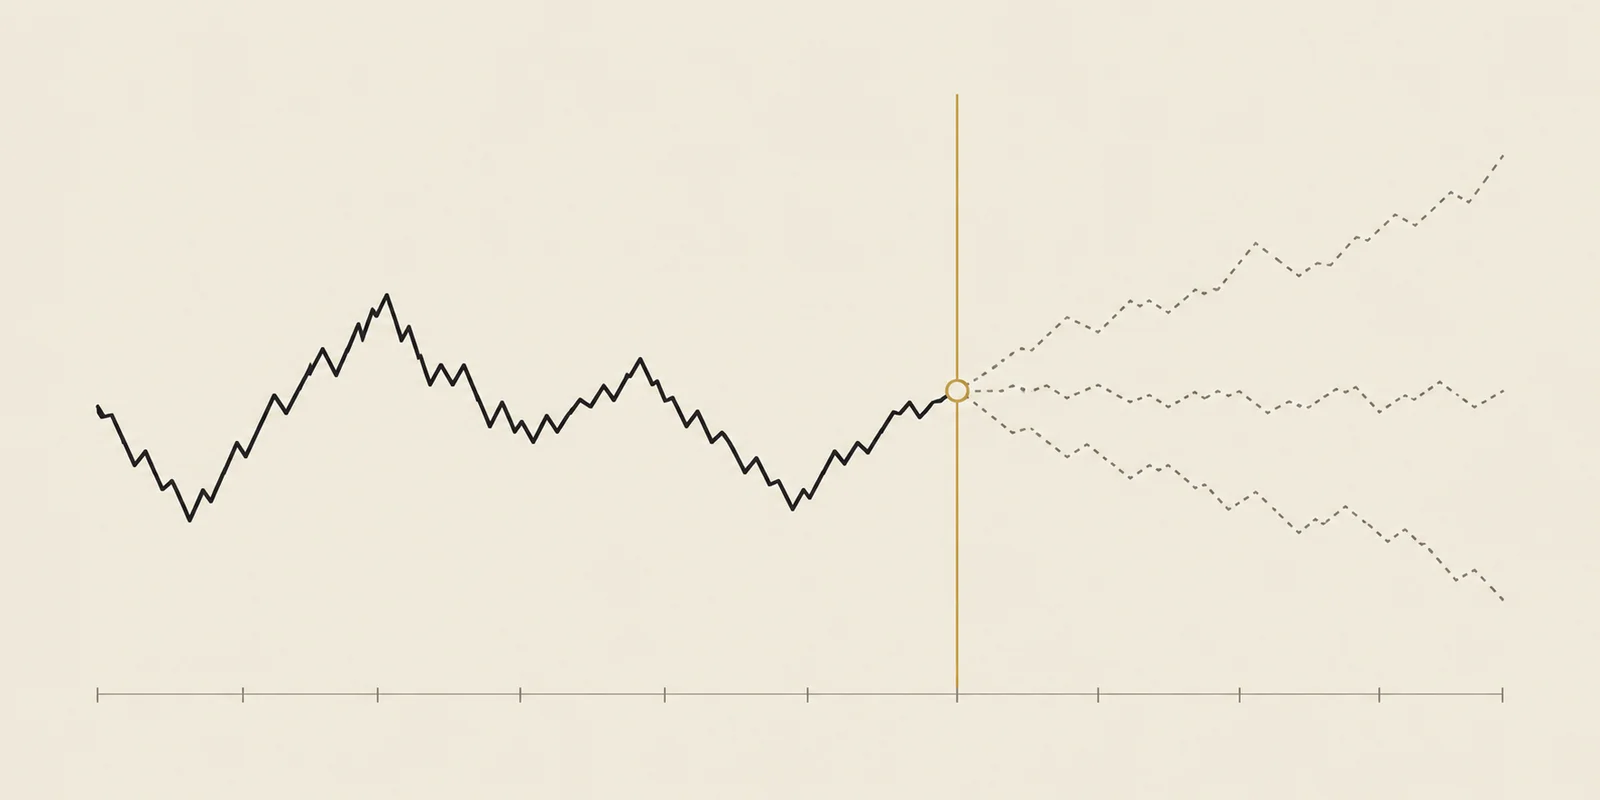
Backtesting applies a trading rule to historical prices and records the simulated outcomes.
Another question we tested

Original research ·
Why buying a breakout late can erase most of the reward
In the fast-moving group, buying later kept much less reward while increasing the risk.
Read the study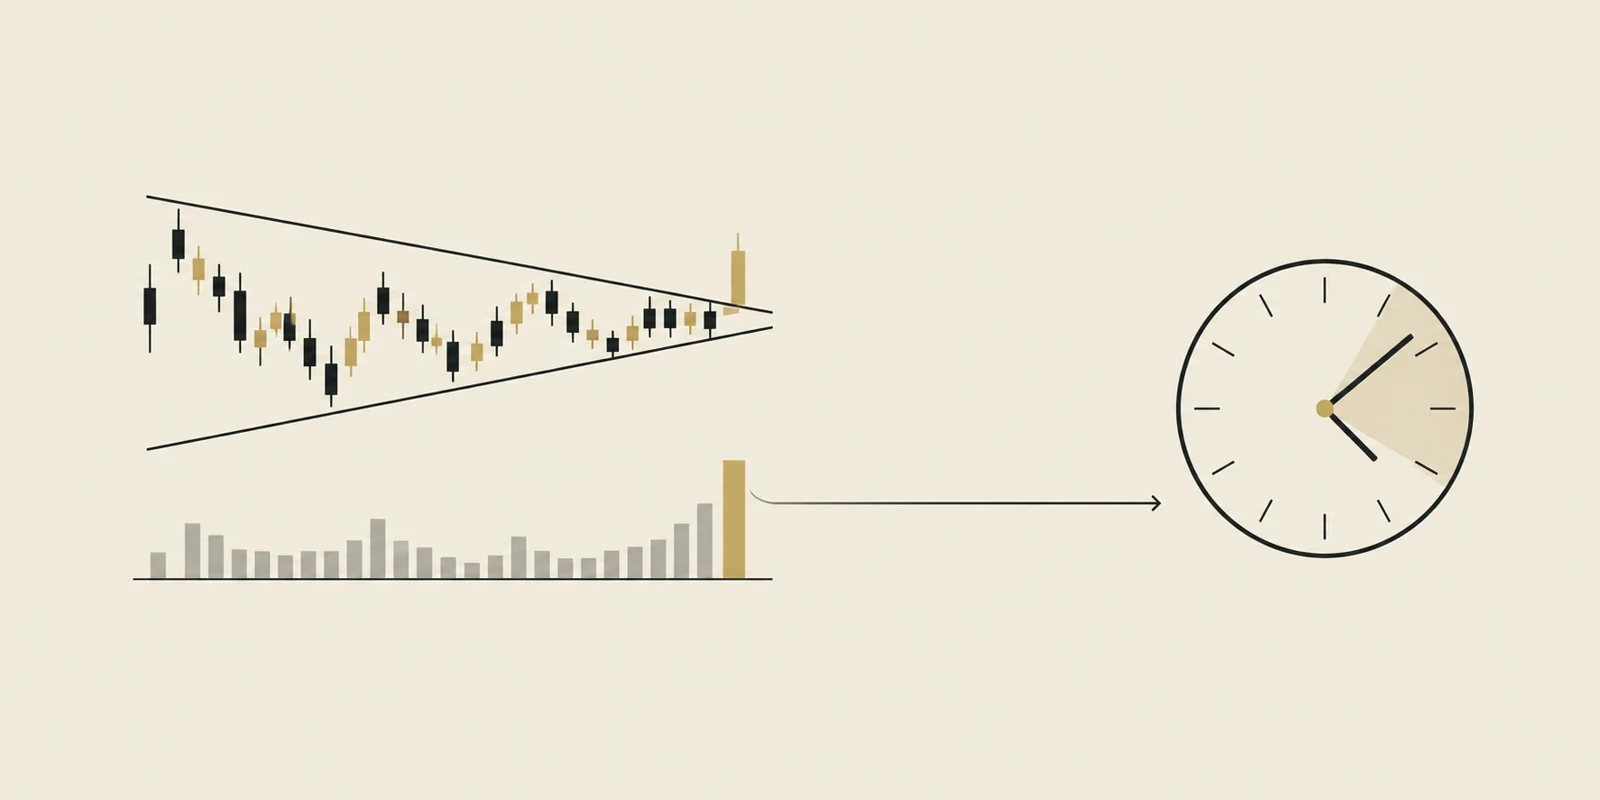
Original research ·
Does volume matter before a breakout?
High volume in the completed breakout bar looked favorable. Evidence for volume known before entry was weaker.
Read the studyEducational research, not investment advice. Historical observations do not predict the next trade. TradingPal publishes this research and sells trading software.