TradingPal vs Finviz
TradingPal vs Finviz for stock screening and chart research
Finviz combines stock screening with financial data, market maps and news. TradingPal scans defined technical setups and places their historical results beside the chart. Which is useful depends on how you choose candidates and what you need to check before a trade.
Typical uses
Finviz
Screen by company and market data
Combine fundamental and technical filters, then review the resulting stocks, sector context and news.
TradingPal
Review defined technical setups
Inspect automatic lines, patterns and the historical results of the platform’s qualifying trade rules.
Using both
Review a screened candidate
After narrowing a list in Finviz, open a supported symbol in TradingPal to examine its chart and available setup history.
TradingPal vs Finviz feature by feature
Finviz’s official feature and pricing pages were checked September 11, 2026. Prices and terms can change; taxes may apply. TradingPal is not affiliated with or endorsed by Finviz.
TradingPal's setup statistics are historical simulated results under defined rules, with wins and losses in the record. They are not live performance, a prediction, or a guarantee of what the next setup will do.
Sources: Finviz Elite features · Finviz screener guide · Finviz pricing FAQ
When Finviz’s broader screening matters
If a company’s financial condition determines whether you trade it, Finviz’s fundamental filters belong early in the process. TradingPal’s technical scanner does not supply that financial screen. Decide how you will perform it before changing your workflow.
Follow a candidate from screening to chart review
Suppose you want to find profitable companies in a particular sector, then examine their recent price patterns. Finviz’s screening fields handle the company selection. TradingPal can add automatic lines, pattern targets and a historical record where its setup rules qualify.
Check that the resulting shortlist still meets your original criteria. A detected pattern adds technical context; the company’s financial condition and news still require their own review.
What to compare before paying
Finviz offers free screening with delayed quotes. Elite adds real-time data, additional screening and charting features, exports and alerts. Its official pricing and feature pages are linked below.
TradingPal Free includes charts, Auto Trendlines, the latest detected pattern and the Morning Brief’s #10 ranked setup. Premium adds the full scanner, complete historical replay, five Brief picks and alerts for followed symbols. Try the part of the workflow you expect to use regularly before comparing subscription costs.
Read the trade rules behind the statistics
A historical setup record measures a specified entry and exit policy. Win rate counts profitable trades; average R measures the mean result relative to planned risk. Read both alongside loss size, sample size and the test period.
The resolved examples let you inspect particular gains and losses. They help explain the rules, while the complete record shows how broadly the result held across the tested sample.
Inspect a qualifying setup’s historical record
The panel below shows the statistics attached to TradingPal’s defined rules. Review the sample and measurement period along with gains, losses and simulated-account drawdown.
The complete backtesting methodology explains portfolio caps, 25-run medians, cost stress, and limitations.
A Scanner Setup and Its Historical Record
Price is compressing into a continuation pattern with an upside measured move.
Track-record sample: Jan 2018 – Mar 2026. Updated April 21, 2026.
Keep comparing
Compare charting, screening and backtesting features in these related guides.
Frequently asked questions
Can TradingPal replace Finviz?
It can cover a technical-setup search, but it does not replace Finviz’s fundamental screening, market maps, news and financial-data workflow.
Does TradingPal have a free plan?
Yes. Free includes charts, Auto Trendlines, the latest detected pattern and the Morning Brief’s #10 ranked setup. The full scanner and complete historical replay require Premium.
Can I use both?
Yes. Screen candidates in Finviz, then open supported symbols in TradingPal to review their technical setup and available historical record.
How do the prices compare?
At the September 11, 2026 check, Finviz Elite listed $39.50 monthly or $299.50 annually. TradingPal Premium lists $15 monthly or $150 annually. Check current prices, taxes and billing terms before subscribing.
What do the historical win rates measure?
They count profitable simulated trades under the stated rules. Actual fills, costs and future market conditions can produce different outcomes.
See It Work — for Free, Every Day.
We post real pattern calls and breakdowns on X — like this June SPY slide, called move by move as it played out. Every call names the level that would prove it wrong, and every call stays up — wins and losses.
Follow @TradingPalHQ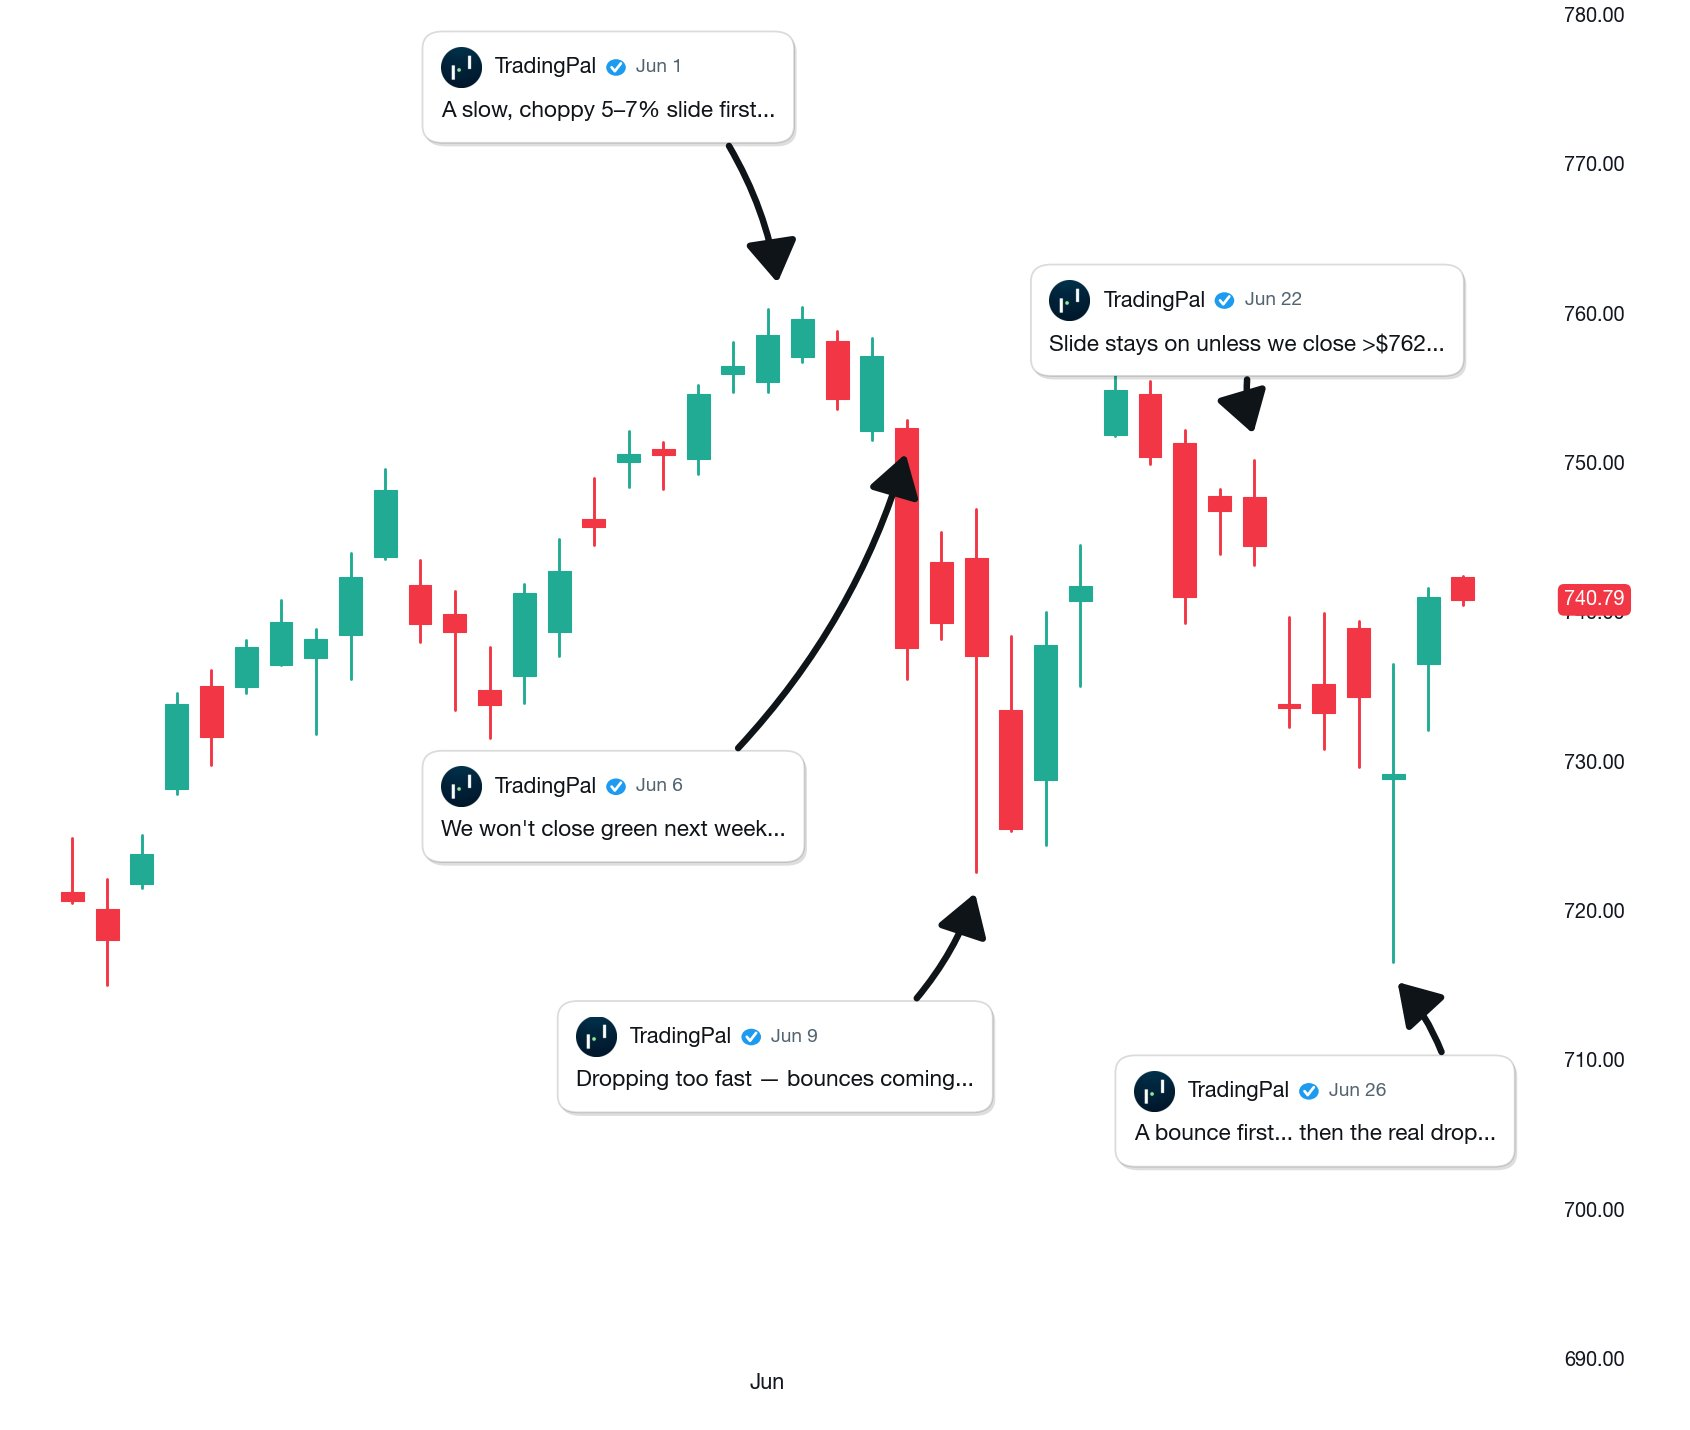 Posted Jun 30, 2026 · open the post to verify
Learn the patterns behind the numbers
The pattern guides explain how to recognize each setup and define its entry and exits. The metrics guides explain how to read its historical results.
See a Qualifying Setup and Its Record
Open a chart free to explore its automatic lines and any qualifying setup available for that symbol. Upgrade when you want the supported universe of 2,600+ symbols scanned nightly.