--Typical return27.8%Won--To entry
SHY
Fibonacci tools divide an earlier price move into percentage levels. Use a $100-to-$120 example to calculate retracements and extensions, choose anchors consistently and interpret overlapping levels.
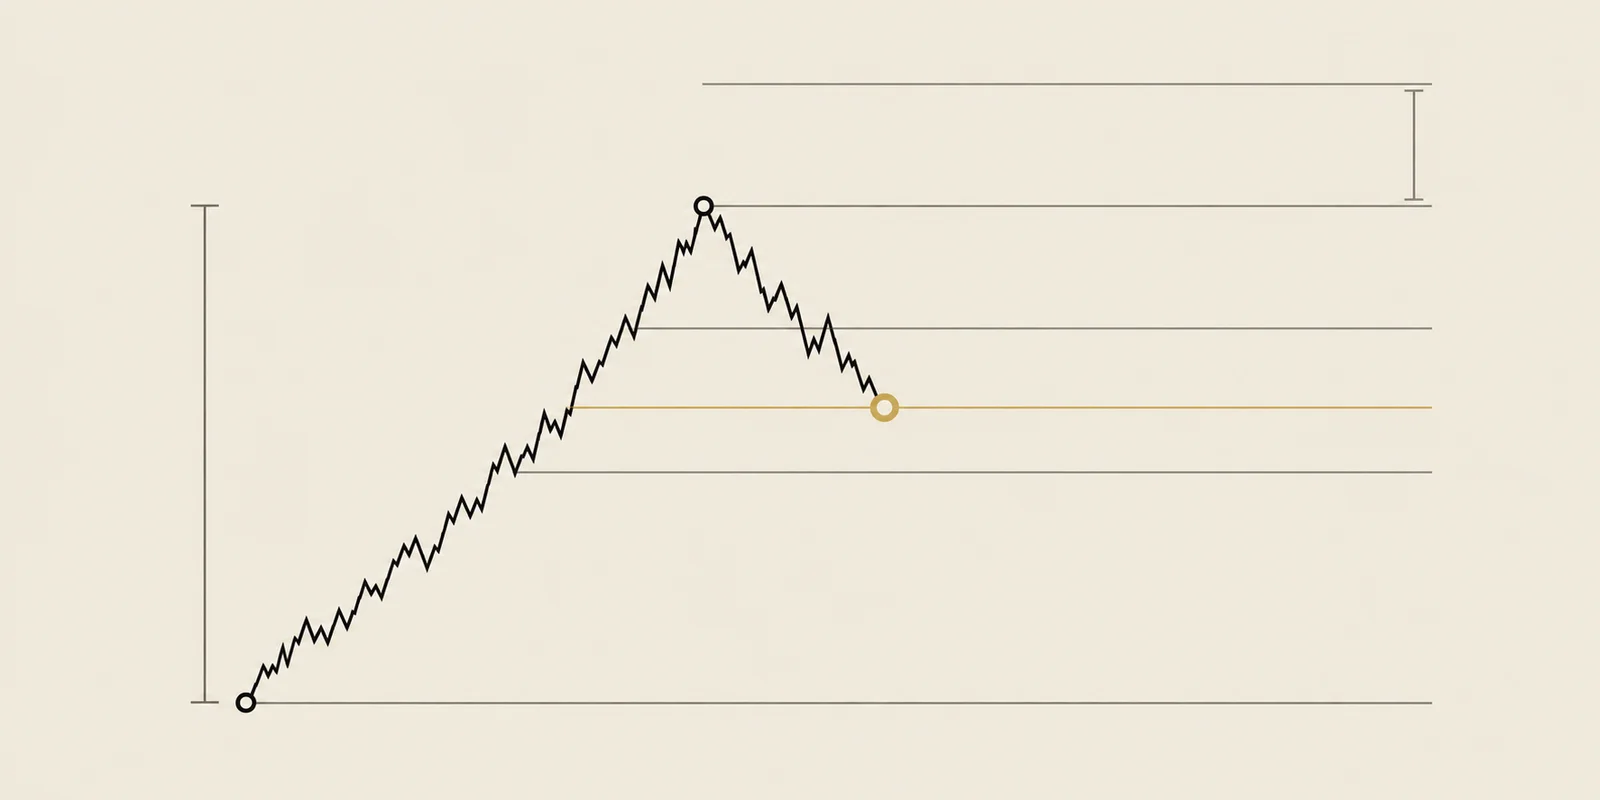
A retracement is a partial reversal of an earlier move. If an illustrative stock rises from $100 to $120, then falls to $110, it has given back $10 of the $20 rise: a 50% retracement.
Fibonacci chart tools mark proportions such as 38.2% and 61.8% of that earlier move. On the same $20 rise, a 38.2% retracement is $7.64 below the high, at $112.36; a 61.8% retracement is $12.36 below it, at $107.64.
The commonly included 50% mark is the halfway point and is not itself a Fibonacci ratio. Extensions use multiples of the move to mark prices beyond its original endpoints.
Those endpoints are the anchors. Measuring from a different low gives a different set of levels. Record the choice before examining the later reaction, as you would when drawing a trend line.
In our $100-to-$120 example, a retreat to $115 gives back one-quarter of the rise; a retreat to $105 gives back three-quarters. The percentages describe the depth of the decline. Whether price subsequently recovers is a separate observation.
Traders sometimes compare a retracement mark with an earlier support area. If both are near $110, that gives them one area to watch. A trade at that price still needs an entry and exit rule.
Using a two-point projection from the $100 low, 127.2% of the $20 move gives $125.44; 161.8% gives $132.36. Both lie above the earlier $120 high. These are illustrative calculations; tools using an additional pullback anchor can place extensions differently.
A trader can use an extension as a planned target. To test that choice, specify whether the trade closes when price reaches it, waits for a close, or follows a trailing exit after arrival. The resulting profit depends on that rule.
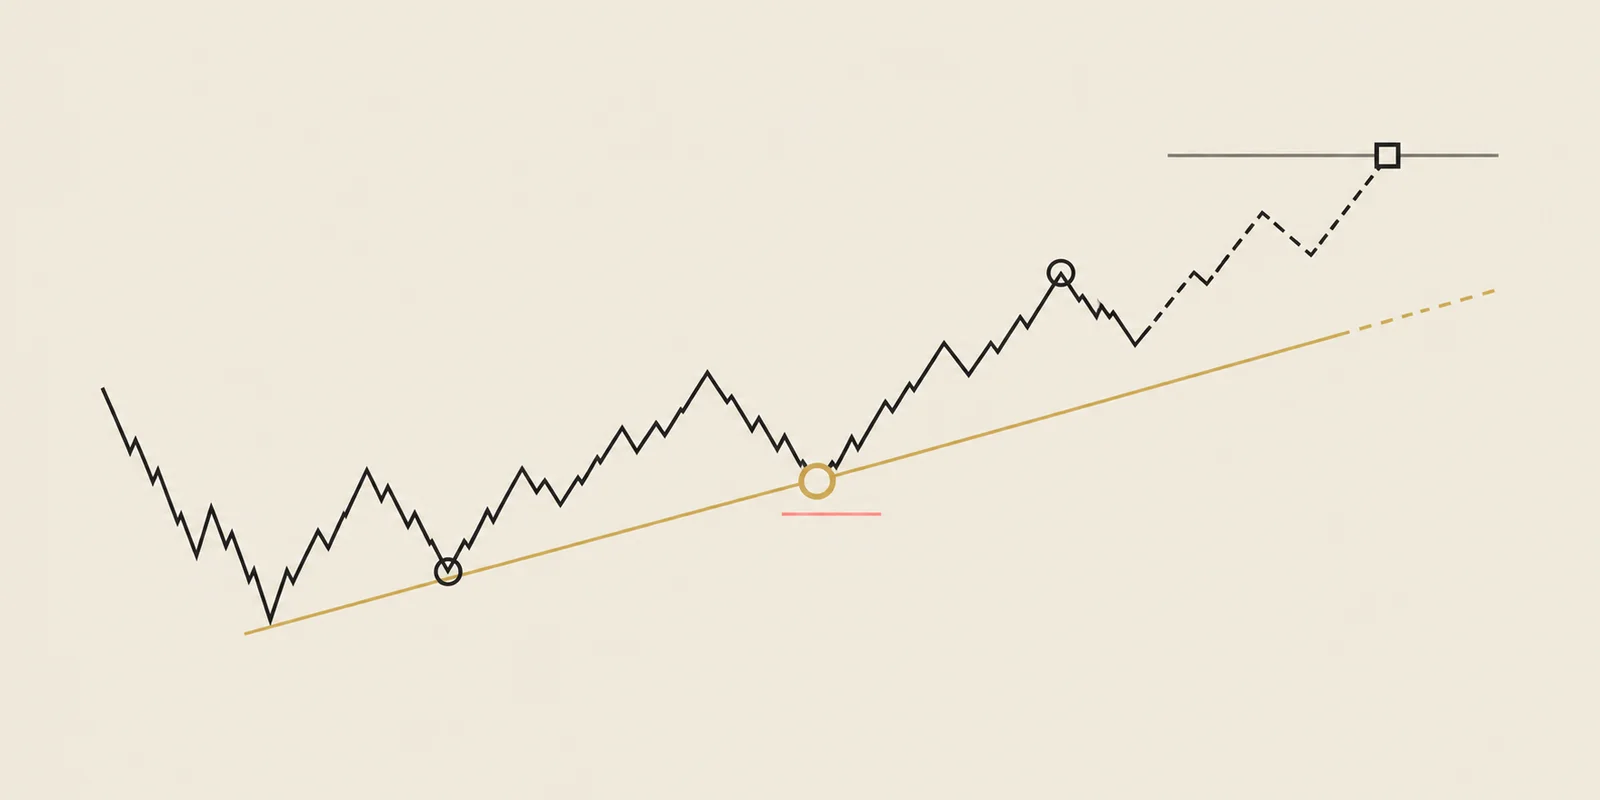
Confluence means separately drawn levels fall near the same price. A Fibonacci level and a trend line may overlap because they use related turning points. Counting them as independent confirmation can overstate how much new information the second tool adds.
The trendline strategy guide explains how to combine a location with entry, safety-exit and target rules. The research discussion on this page addresses what the saved comparison can tell us about Fibonacci levels themselves.
Read the full research report for the recorded comparison, methods and limitations.
In our saved monthly retracement study, the single Fibonacci-level group had a rebound rate close to the changed-ratio comparison. Overlapping levels did not have a higher recorded rebound rate. The historical anchor labels and incomplete data archive limit what we can conclude.
In plain English: the Fib label alone did not add dependable bounce odds in that test. That does not make the tool useless. It can describe location and trade geometry; it just does not create odds by itself. The statistics below belong to the full setup—context, qualification, entry, stop, and exit—tested together. Read how TradingPal backtests trendlines for the method behind that result.
Historical simulation of the complete named setup, not a generic trend-line result. Weekly is the primary view. Read the methodology →
163 structures found. See example
The day's #10 ranked setup, in your inbox.
Every morning we hand you the highest-ranked breakout structure found in our scan across 2,600+ tickers — Free.
See the full offeringRead these limits with the table below.
The sample, instrument scope and dates belong to this exact setup book. Extreme drawdowns remain visible rather than being hidden.
| View | Scope | Trades | Win rate | Average trade | Profit factor | Max drawdown |
|---|---|---|---|---|---|---|
| Weekly | 598 symbols | 6,728 | 34.5% | +3.03R | 2.11 | 100.0% |
| Monthly | 514 symbols | 2,844 | 44.2% | +9.63R | 5.28 | 74.0% |
Backtest window: 2021-12-06 to 2026-07-13. Data snapshot: 7/23/2026. Historical results can differ from live fills and do not predict future performance.
Retracements measure a partial reversal within an earlier move. Extensions project multiples of that move beyond an endpoint.
There is no universally strongest ratio. Evaluate the selected anchors and the complete trade rule under the conditions being tested.
That requires a comparison under defined trade rules. Two overlapping levels may derive from the same price move and need not provide independent evidence.
They may choose different starting and ending prices, timeframes, scales or projection conventions. Record those choices before comparing the levels.
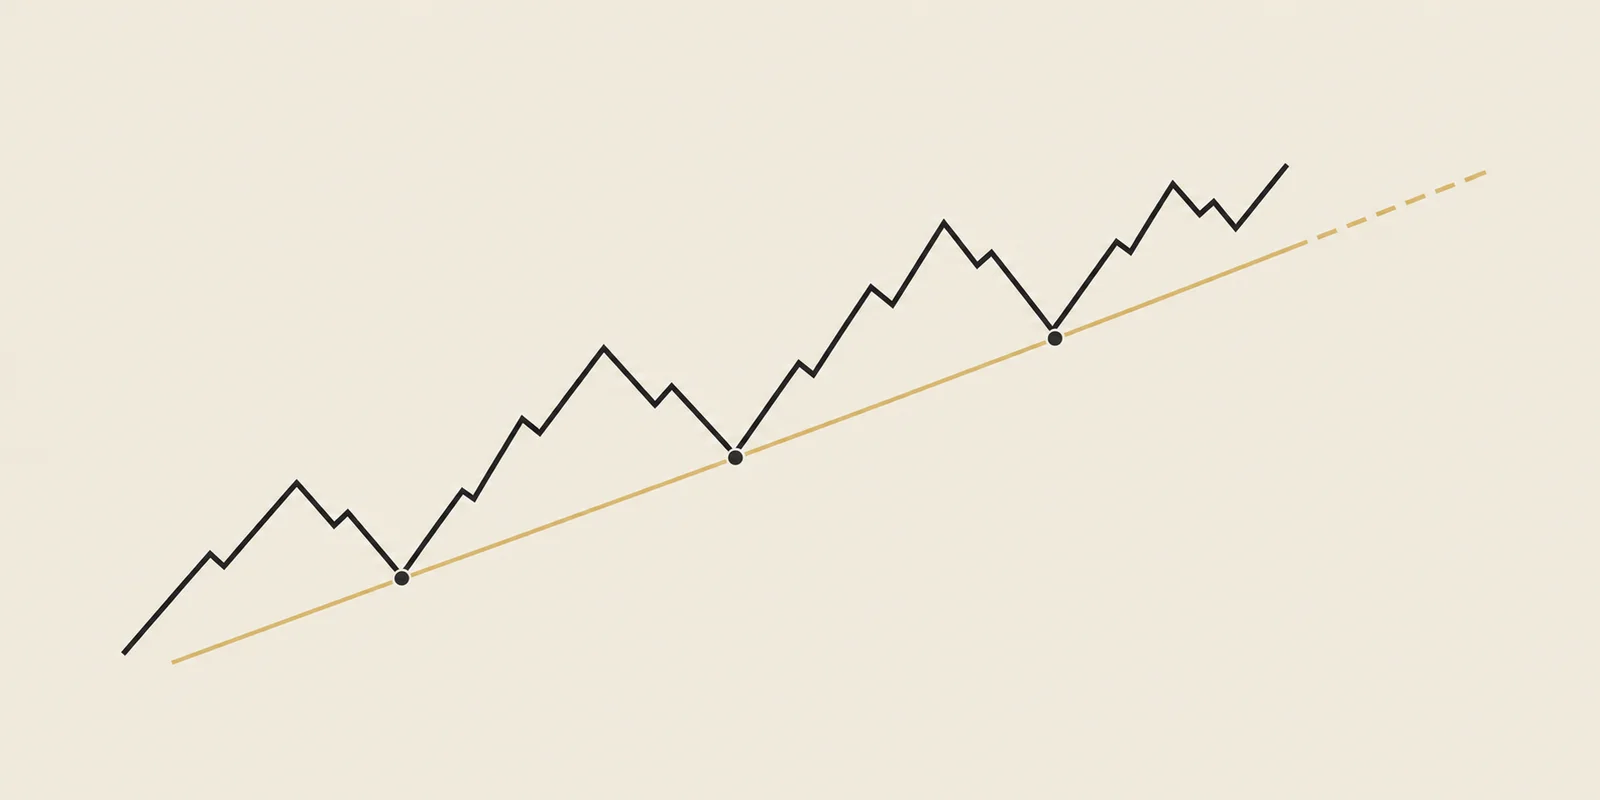
A trend line joins earlier turning points on a chart.
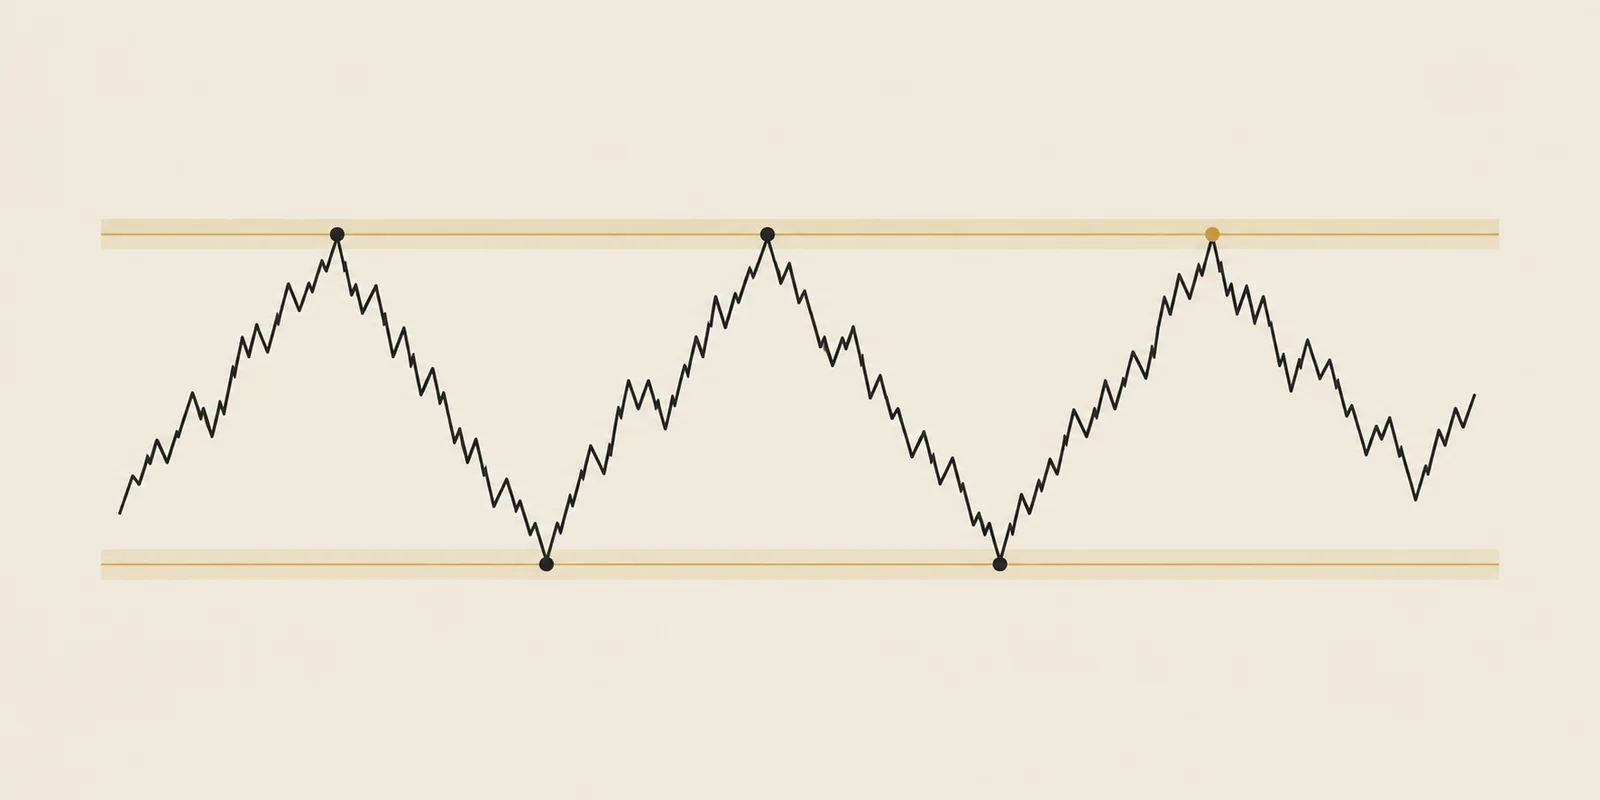
Support and resistance mark areas where earlier declines or rallies stopped.
A trendline trade needs rules for choosing the line, entering, sizing the position and exiting.
Open the screener to compare current setups, their visible lines and their historical track records.
Explore the screener →Educational content, not investment advice. Backtests are historical simulations and do not predict the next trade.