--Typical return27.8%Won--To entry
SHY
A trend line joins earlier turning points on a chart. Learn how to draw one consistently, interpret later touches and judge what the drawing can tell you.
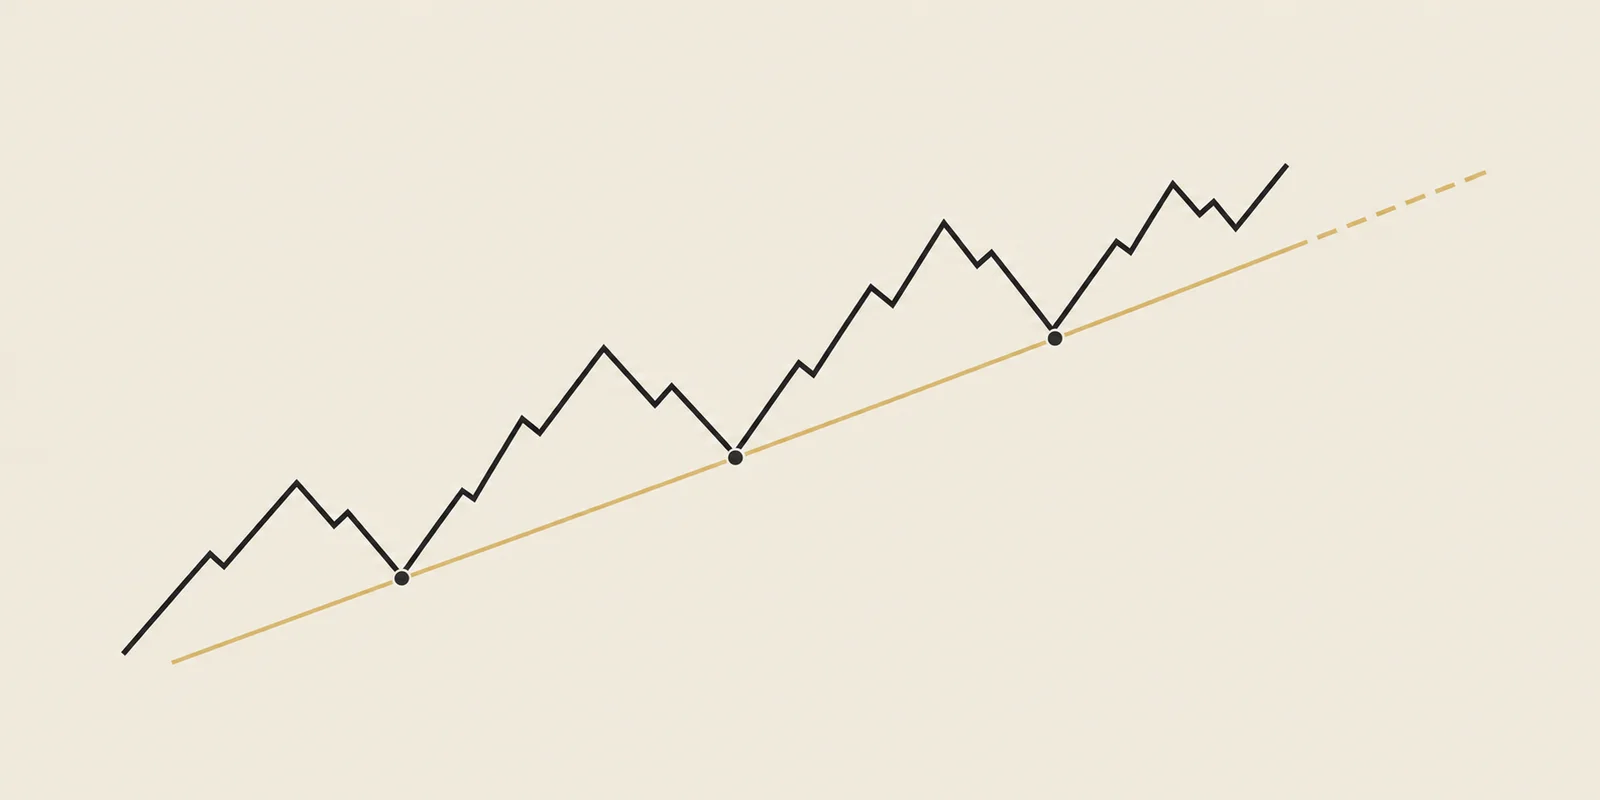
A trend line joins two or more turning points and extends their path forward. Imagine a stock recovering from $80, then later from $85. Joining those lows produces an upward-sloping line. These prices are illustrative.
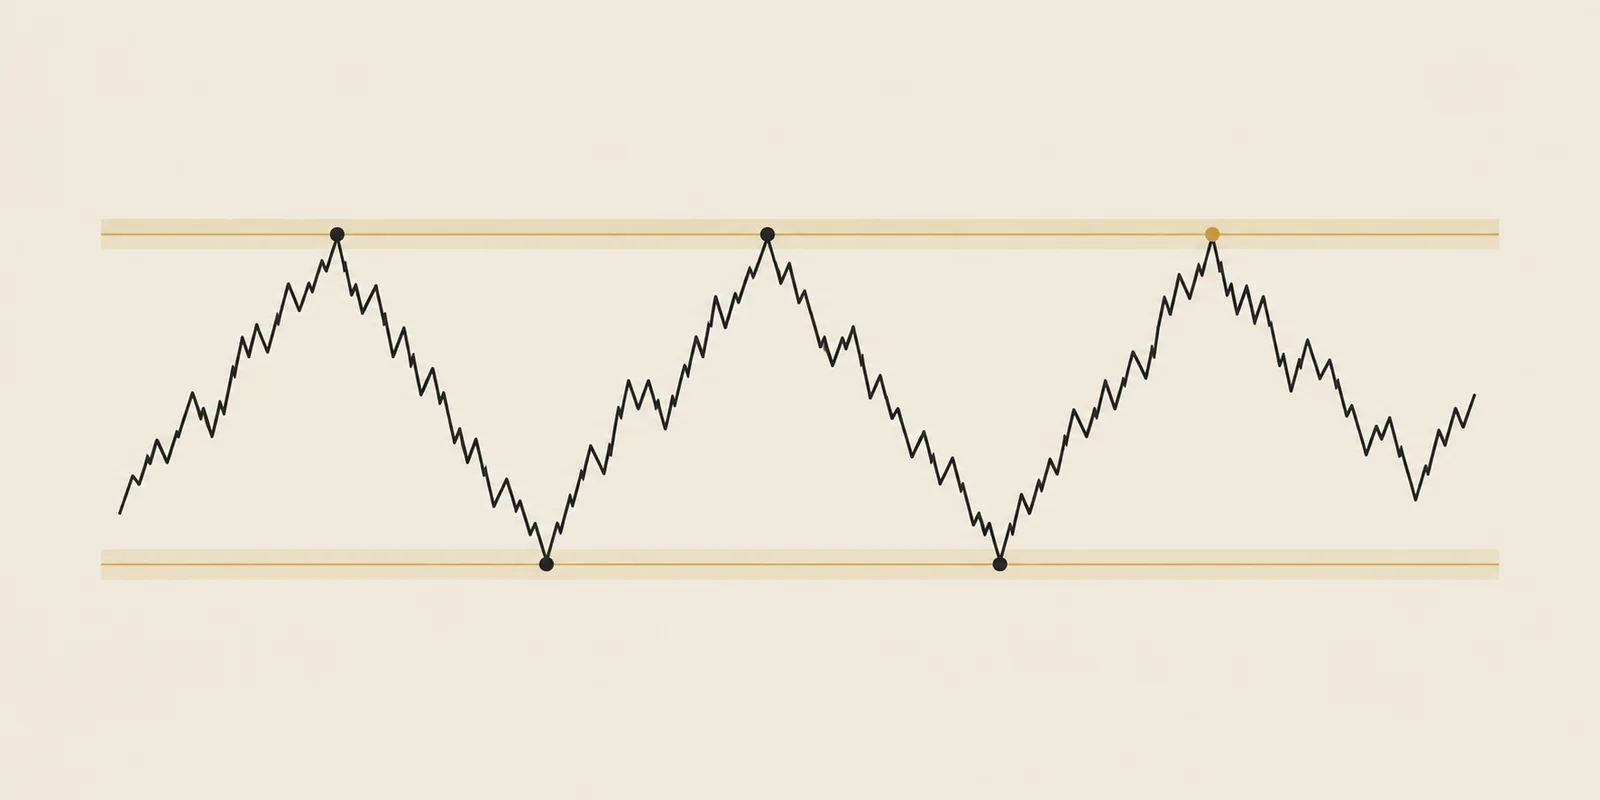
A low where price turns upward is called a swing low. A high where it turns downward is a swing high. Lines under lows describe support; lines across highs describe resistance. The support and resistance guide explains those roles.
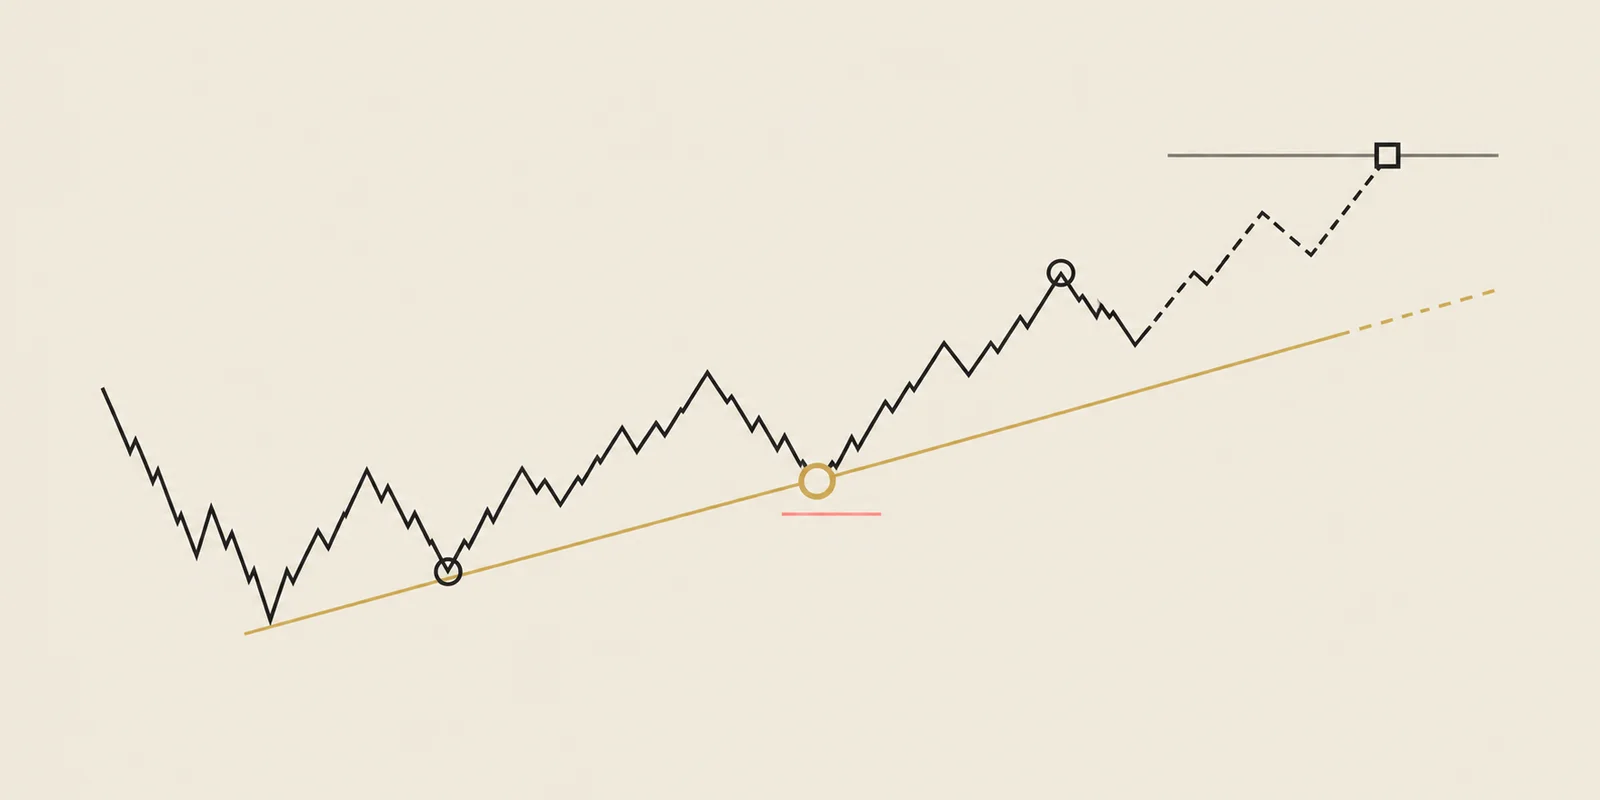
The line also changes with time. In our example, extending it tells you where that path reaches on a later date. You can compare the next decline with that location, then observe whether price recovers or crosses it.
The original points are called anchors. Two anchors determine a straight line; later approaches show how subsequent prices relate to it. If you move an anchor after a later decline, you are evaluating a different line.
A touch is an approach close enough to count under the rule being used. Prices seldom land exactly on a drawn line, so a repeatable method needs a consistent way to judge nearby prices.
Several adjacent candles near the line can belong to one prolonged visit. Separate visits, with price moving away between them, describe different events. A larger touch count alone does not establish a higher chance of recovery.
Each daily candle summarizes one trading day; weekly and monthly candles combine longer periods. A line drawn from monthly turning points can describe years of movement, while a daily line may describe a recent pullback.
Choose the interval that matches the question. TradingPal’s support and resistance setup records use weekly and monthly charts. Compare a line with prices from its own series so its turning points and later tests remain consistent.
Read the full research report for the recorded comparison, methods and limitations.
In our broad monthly and weekly study, raw trend lines by themselves did not produce a dependable bounce advantage over comparison locations. That negative result matters: a line can organize a chart without forecasting the next move.
That is why TradingPal publishes odds for a complete, repeatable setup—not for the mere presence of a line. The evidence panel below includes the qualification, entry, risk control, and exit. You can see how that evidence is separated and validated in how TradingPal backtests trendlines.
Historical simulation of the complete named setup, not a generic trend-line result. Weekly is the primary view. Read the methodology →
163 structures found. See example
The day's #10 ranked setup, in your inbox.
Every morning we hand you the highest-ranked breakout structure found in our scan across 2,600+ tickers — Free.
See the full offeringFor the stock that recovered from $80 and $85, you now have a way to describe the path of those recoveries. To study a trade near its extension, specify how close price must come, when you would enter and how you would exit.
The trendline strategy guide develops those decisions. The historical discussion on this page explains why a line’s appearance and the results of a complete trading rule must be evaluated separately.
Read these limits with the table below.
The sample, instrument scope and dates belong to this exact setup book. Extreme drawdowns remain visible rather than being hidden.
| View | Scope | Trades | Win rate | Average trade | Profit factor | Max drawdown |
|---|---|---|---|---|---|---|
| Weekly | 598 symbols | 6,728 | 34.5% | +3.03R | 2.11 | 100.0% |
| Monthly | 514 symbols | 2,844 | 44.2% | +9.63R | 5.28 | 74.0% |
Backtest window: 2021-12-06 to 2026-07-13. Data snapshot: 7/23/2026. Historical results can differ from live fills and do not predict future performance.
Two points define it. Later independent visits help describe how price behaved around the extension, but a touch count alone does not establish predictive value.
Choose a convention and apply it throughout the test. Changing between closes and extremes after seeing an outcome can bias the drawing.
Steepness describes the rate of price change on the chosen scale. It does not establish a universal probability of a later recovery.
A line identifies a price location to study. Predictive claims require a defined outcome and a historical comparison with the limitations made explicit.
Support and resistance mark areas where earlier declines or rallies stopped.
A trendline trade needs rules for choosing the line, entering, sizing the position and exiting.
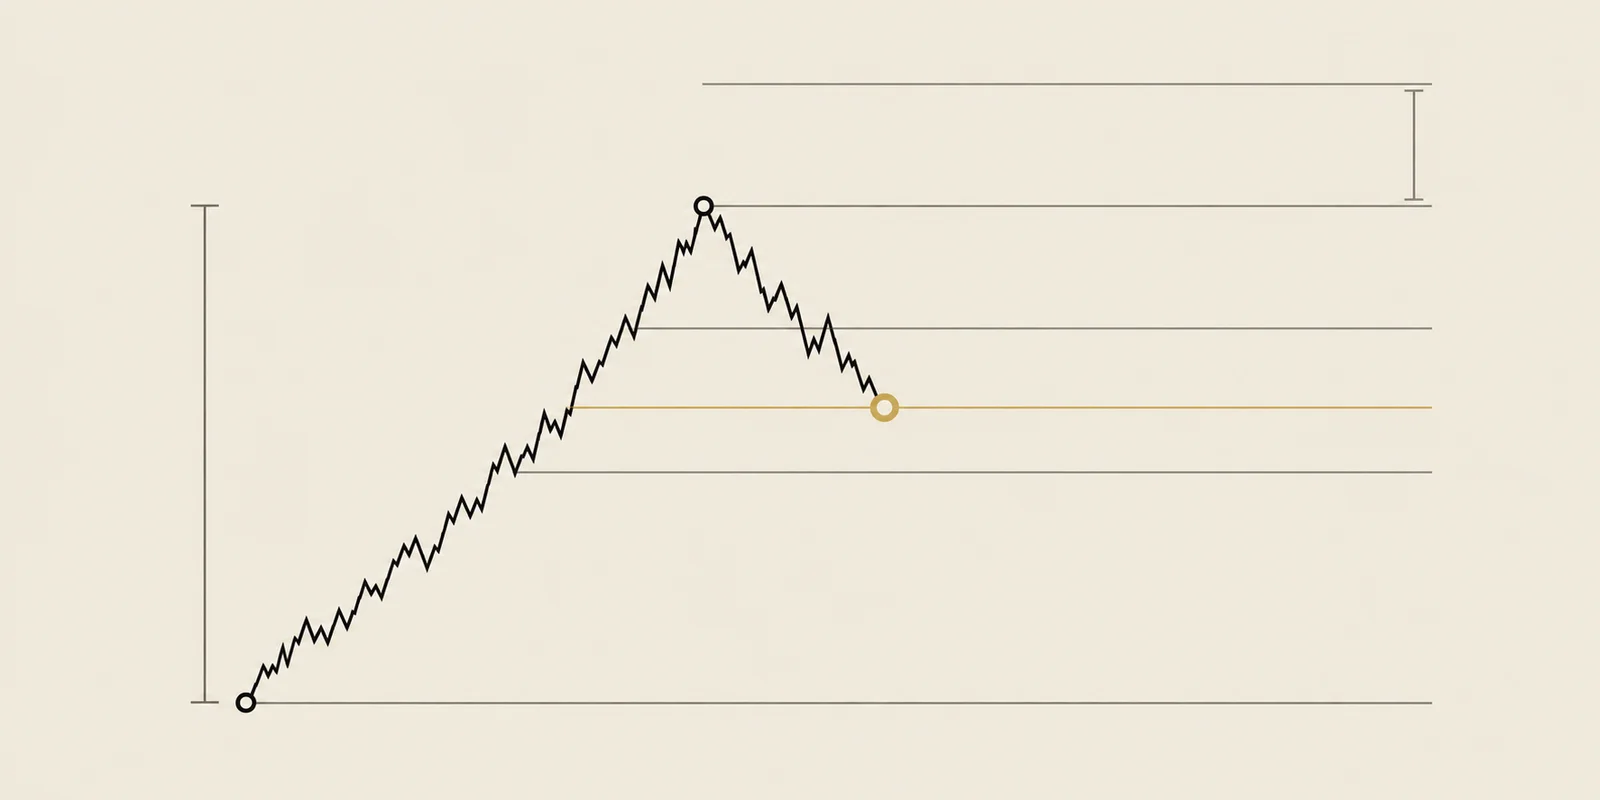
Fibonacci tools divide an earlier price move into percentage levels.
Open the screener to compare current setups, their visible lines and their historical track records.
Explore the screener →Educational content, not investment advice. Backtests are historical simulations and do not predict the next trade.