--Typical return27.8%Won--To entry
SHY
Support and resistance mark areas where earlier declines or rallies stopped. A price example shows how to identify those areas, interpret a crossing and define a trade around them.
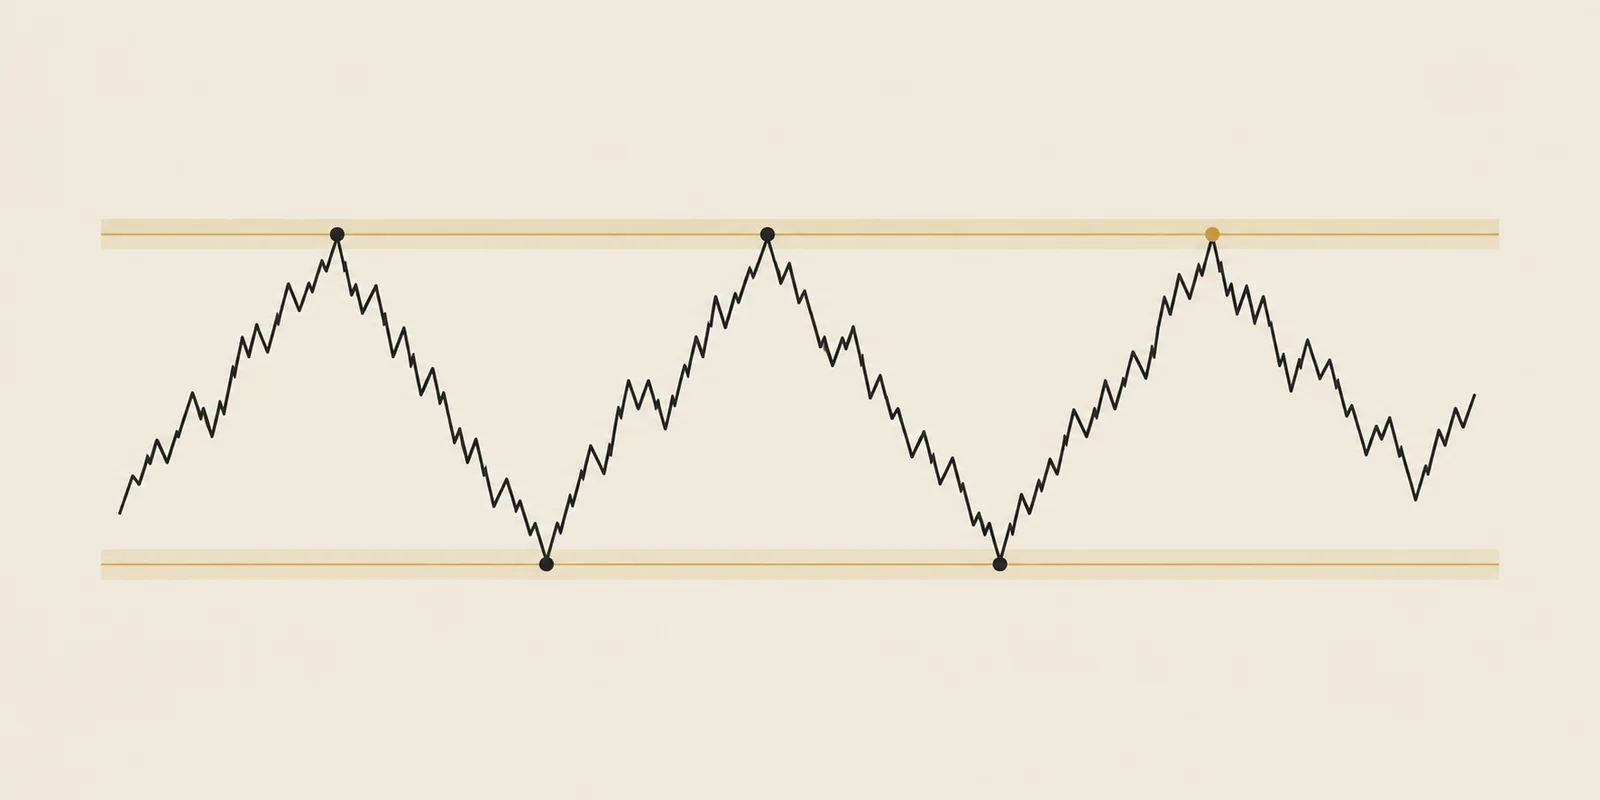
Suppose an illustrative stock has recovered several times near $40 and stalled several times near $50. Traders call the lower area support and the upper area resistance. Those labels describe the earlier reactions and the areas they are watching next.
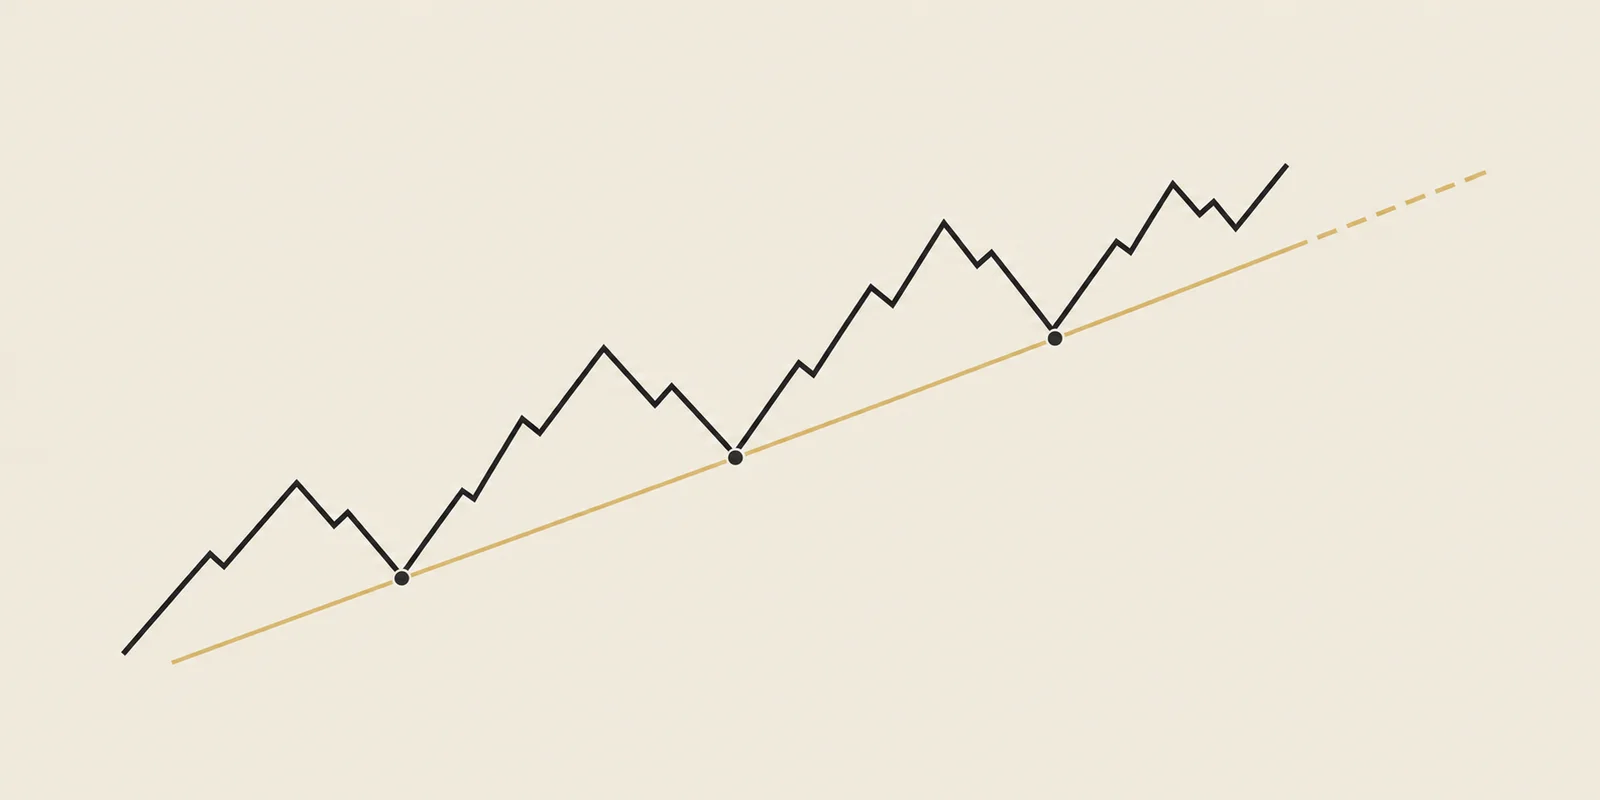
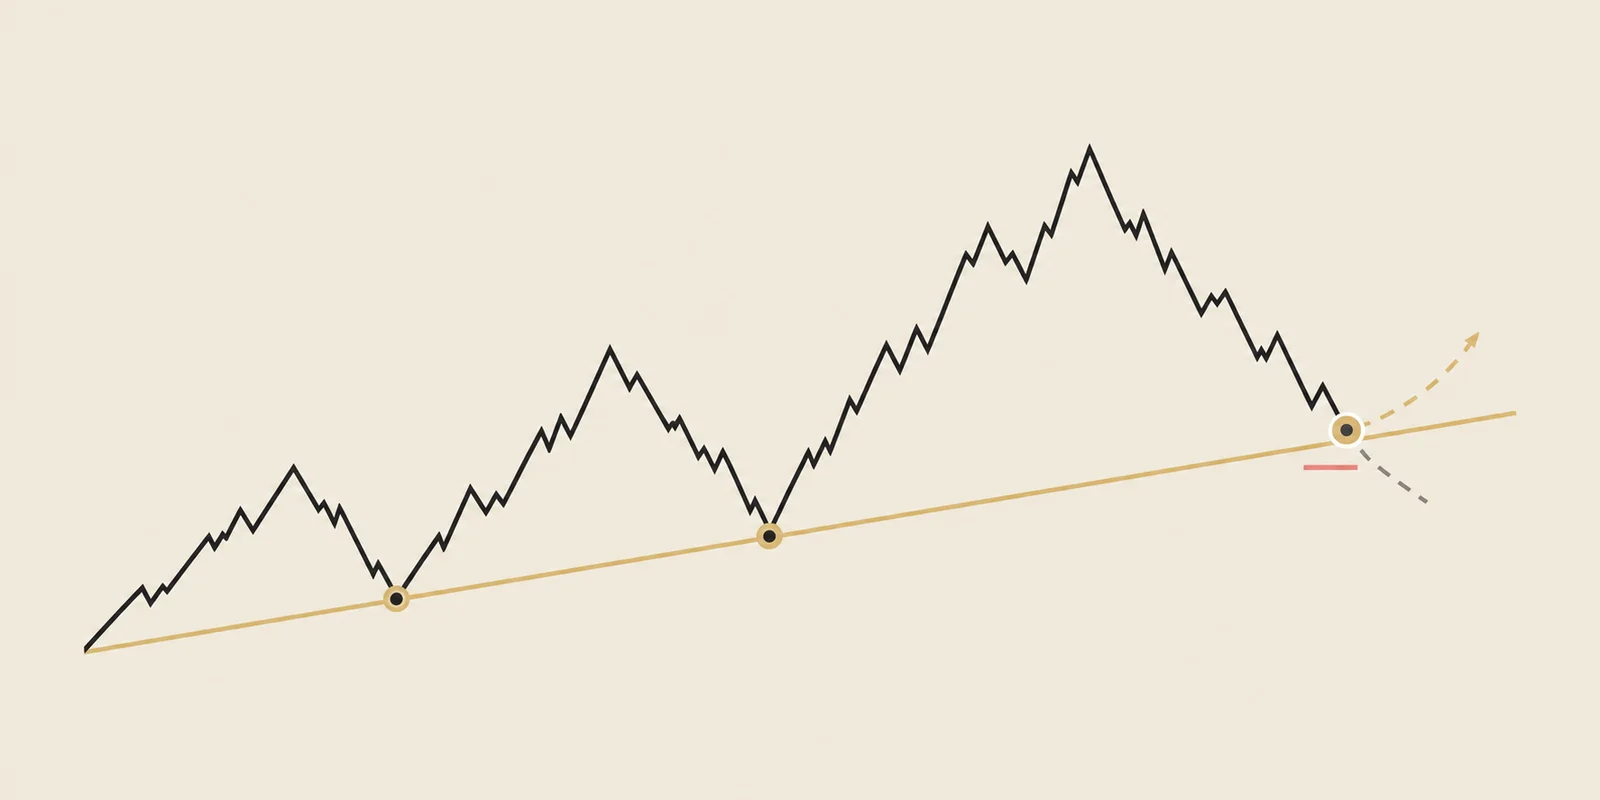
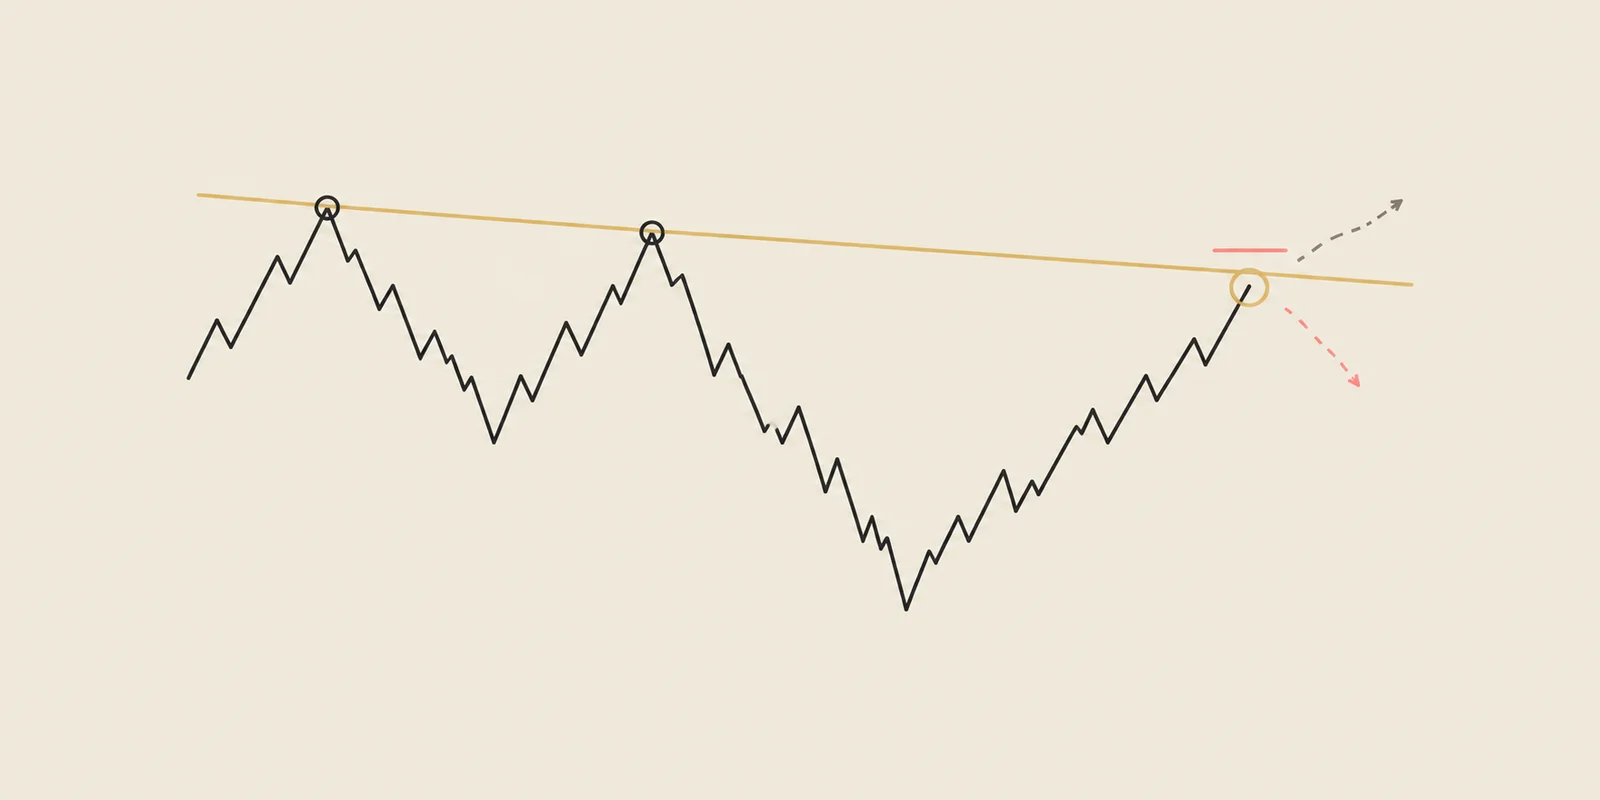
Support is approached from above; resistance is approached from below. Both can be horizontal areas like $40 and $50, or sloping paths through turning points. The latter are trend lines.
A stock might recover from $39.80 on one visit and $40.20 on another. Treating them as a support area acknowledges that prices need not match exactly. A systematic trade still needs a specific entry rule within or around that area.
If the example stock rises above $50, that former resistance is now below price. Traders may watch a return to $50 as a possible support test. If it falls below $40, that former support can become an area watched for resistance.
Whether a later reaction occurs remains uncertain. Record the crossing and subsequent test separately, and specify which event makes a trade eligible.
A bounce approaches an area and moves away. A breakout moves through it, while a false breakout crosses and then returns. These descriptions are easy to apply afterward; a trading rule has to say when enough information exists to act.
For example, a rule that waits for a daily close beyond $50 enters later than one triggered during the day. Each produces different fills and risks. The strategy guide connects those choices to the safety exit.
Our research did not find a dependable edge from raw displayed lines alone. The historical results below belong to TradingPal’s named support and resistance setups, which define the context, entry, invalidation and exit together.
Here is the important distinction: the line is the location; the complete trade plan is what earns the track record. Otherwise it is easy to assign the outcome of a carefully filtered strategy to every hand-drawn level that merely looks similar. How TradingPal backtests trendlines explains that separation.
Historical simulation of the complete named setup, not a generic trend-line result. Weekly is the primary view. Read the methodology →
163 structures found. See example
The day's #10 ranked setup, in your inbox.
Every morning we hand you the highest-ranked breakout structure found in our scan across 2,600+ tickers — Free.
See the full offeringThe $40 and $50 areas give our example a structure to examine. An entry near $40 still needs a safety exit, a position size and a rule for taking a gain. Those choices determine what a backtest measures.
The Support trendlines and Resistance trendlines guides describe TradingPal’s named rules. Their records apply to the complete setups and their stated instrument scope.
Read these limits with the table below.
The sample, instrument scope and dates belong to this exact setup book. Extreme drawdowns remain visible rather than being hidden.
| View | Scope | Trades | Win rate | Average trade | Profit factor | Max drawdown |
|---|---|---|---|---|---|---|
| Weekly | 598 symbols | 6,728 | 34.5% | +3.03R | 2.11 | 100.0% |
| Monthly | 514 symbols | 2,844 | 44.2% | +9.63R | 5.28 | 74.0% |
Backtest window: 2021-12-06 to 2026-07-13. Data snapshot: 7/23/2026. Historical results can differ from live fills and do not predict future performance.
Support is an area approached from above where earlier declines recovered. Resistance is approached from below where earlier rallies stalled.
They are often treated as areas because separate reactions can occur at nearby prices. A systematic entry still needs a precise rule.
Additional visits provide more observations, but their count alone does not establish a higher probability of a future bounce.
The chosen rule might require an intraday crossing, a close or a later retest. State the rule before evaluating the outcomes.
A trend line joins earlier turning points on a chart.
The Support trendlines strategy uses a planned entry above a qualifying support line on weekly or monthly charts.
The Resistance trendlines strategy tests ETF trades near weekly or monthly resistance.
Open the screener to compare current setups, their visible lines and their historical track records.
Explore the screener →Educational content, not investment advice. Backtests are historical simulations and do not predict the next trade.