--Typical return27.8%Won--To entry
SHY
A trendline trade needs rules for choosing the line, entering, sizing the position and exiting. Follow those decisions in order, then compare the plan with the historical record.
A systematic trendline strategy specifies the same decisions for every eligible chart. Another person should be able to apply its rules and identify the same line, entry and exits.
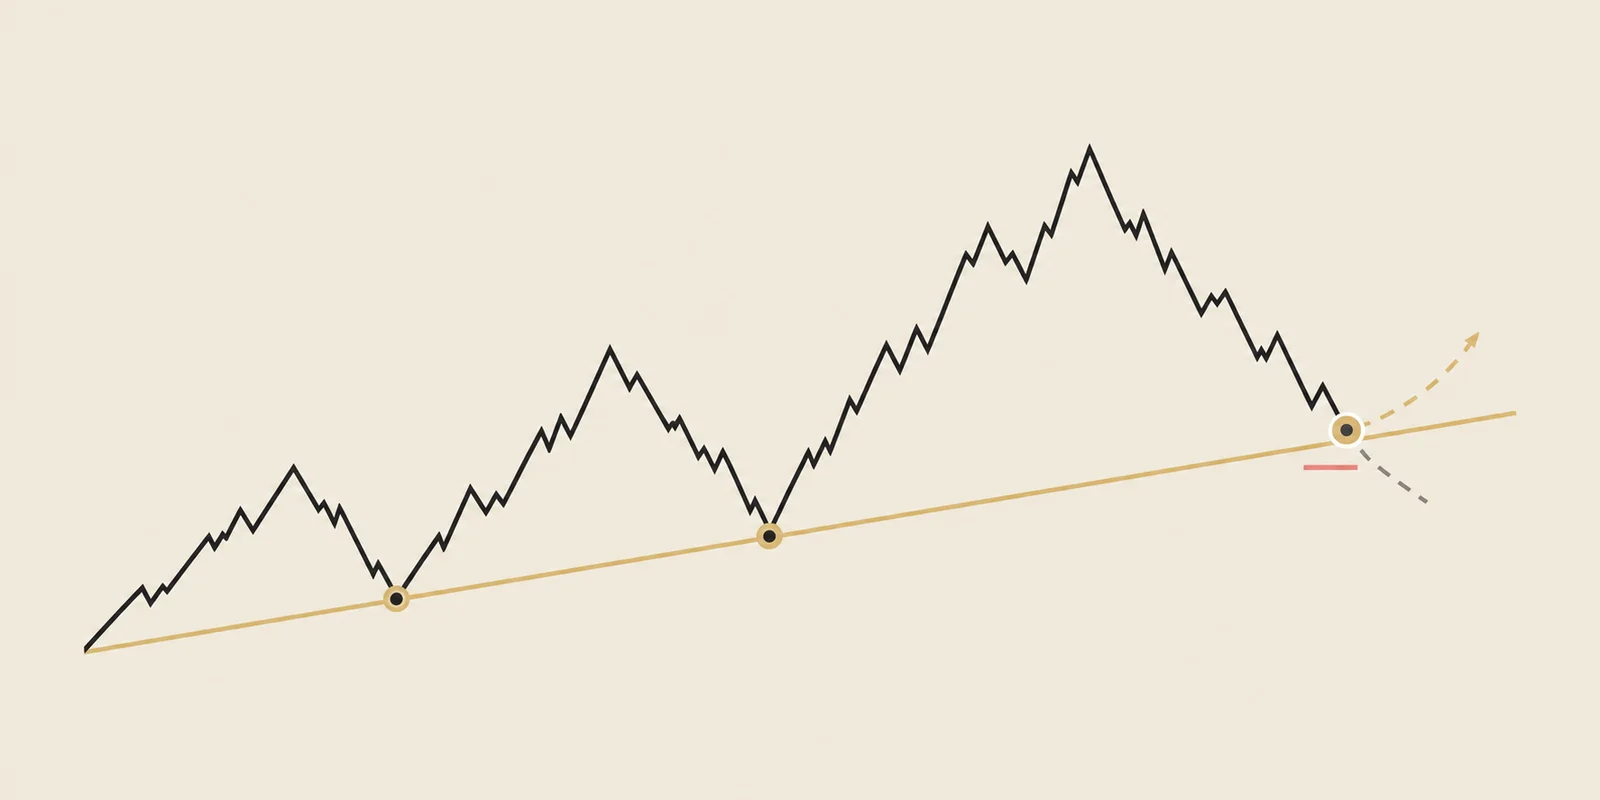
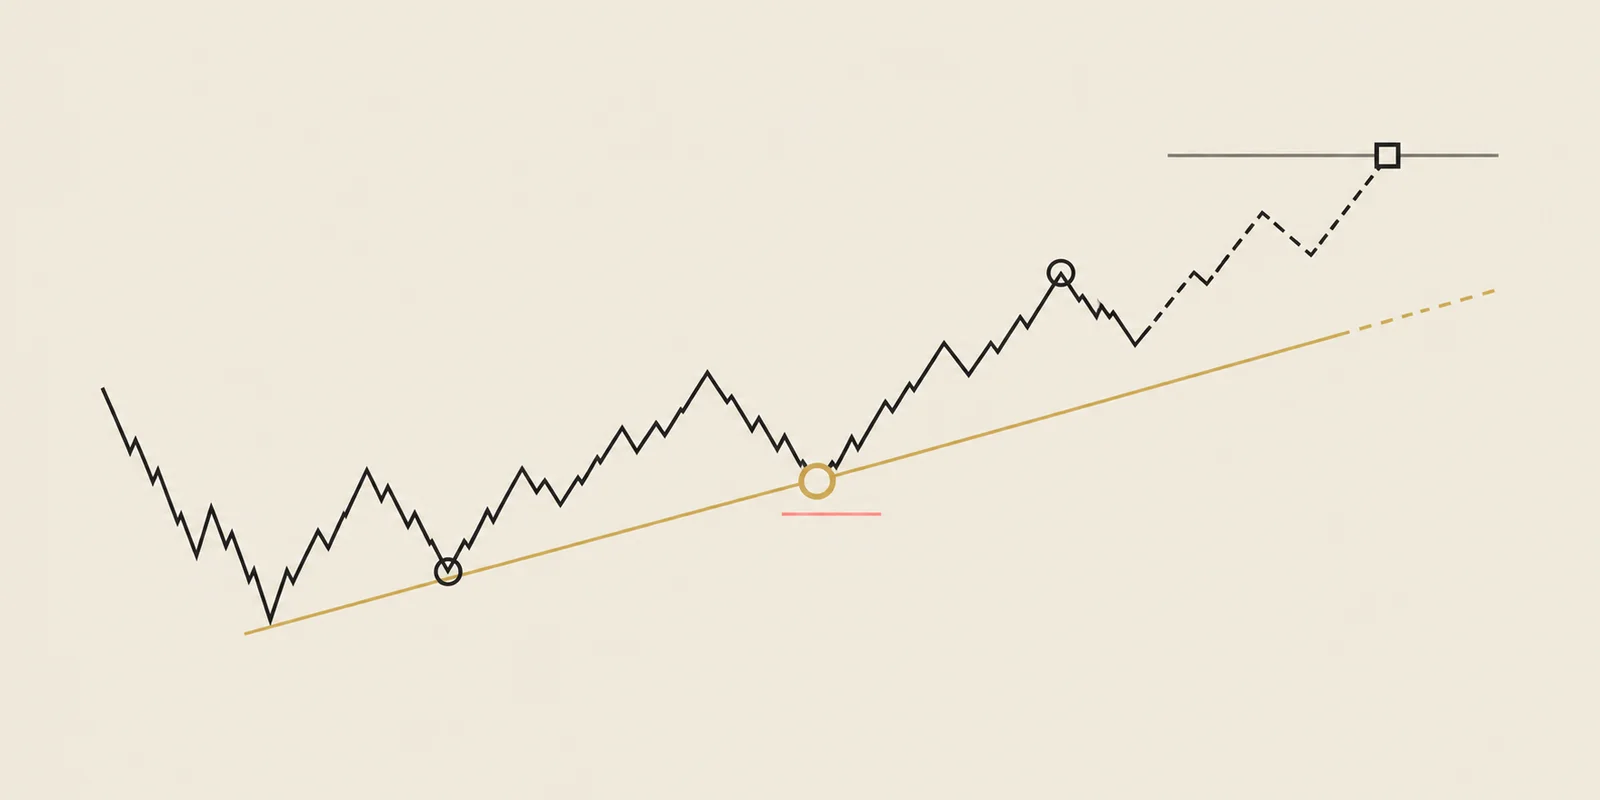
Imagine support near $100, a planned entry at $101 and a safety exit at $97. These illustrative prices define $4 of planned risk per share. They are the beginning of a trade plan; you still need to choose the timeframe, target and conditions for an actual fill. The trend line basics explain how the line is drawn.
TradingPal applies its named setup rules consistently across the supported universe. The support and resistance guide explains the price roles that begin this process.
A trade could start when price reaches a level, after a closing-price confirmation or on a later retest. Choose one rule and apply it to every eligible case.
For the illustrative $101 entry, say how the order fills if price reaches $101 and how an overnight gap is handled. An unfilled order remains unfilled even if price subsequently moves toward the target.
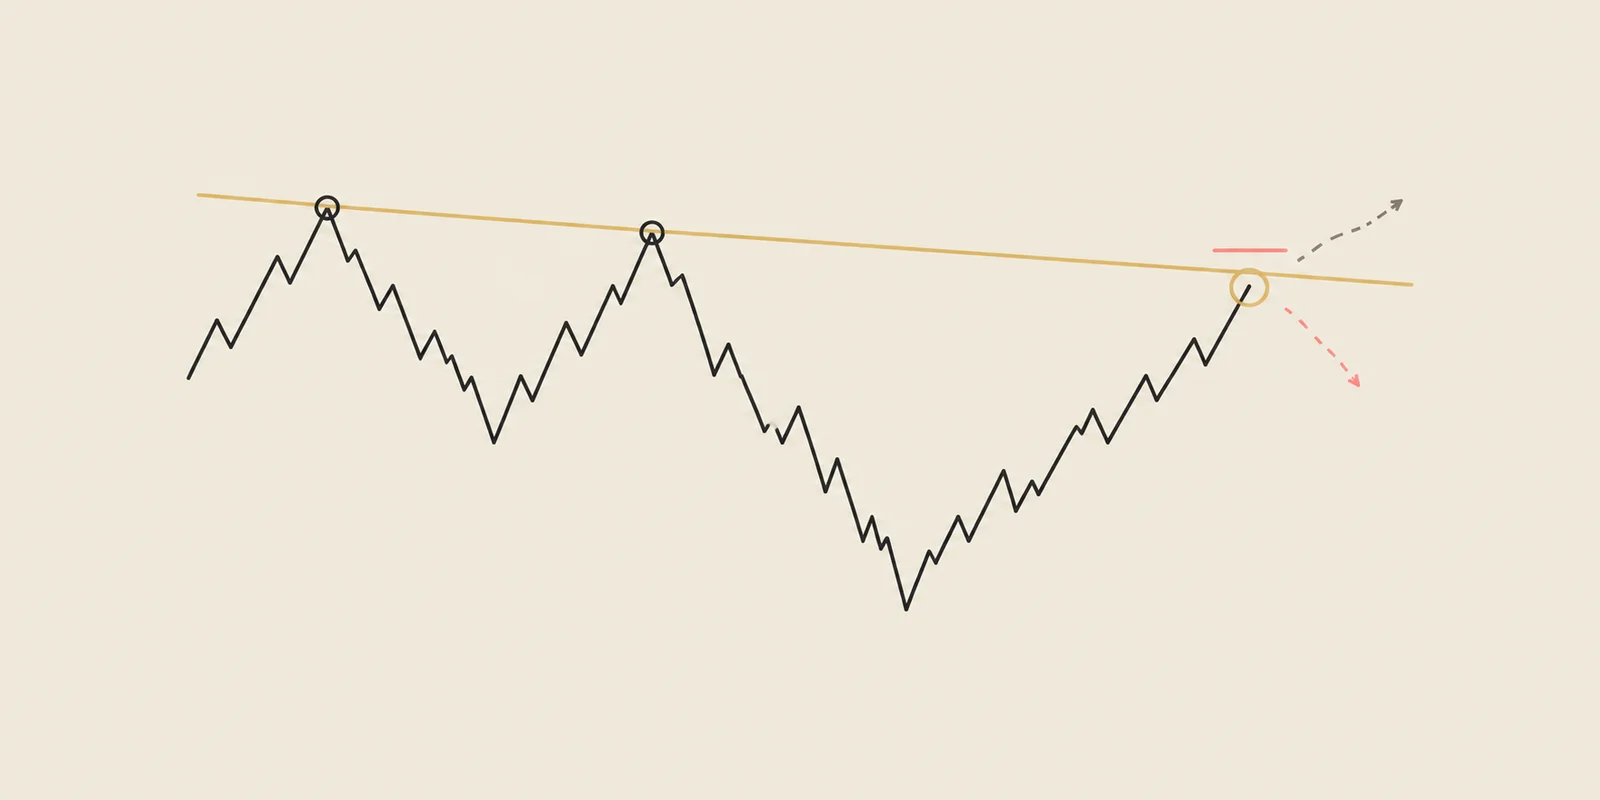
Choose the price event that ends the trade if it moves against the plan. A support trade places its safety exit below the relevant structure; a resistance short places it above. Also specify whether touching that price is enough or a closing-price condition is required.
With a $101 entry and $97 planned stop, $100 of planned account risk allows 25 shares before other caps. A wider entry-to-stop distance allows fewer shares. A gap or delayed exit can still produce a loss larger than $100.
The target might be an opposing support or resistance level, a fixed multiple of risk or a moving-average exit. A moving average is the average price over a defined number of candles; its interval must match the trade rule.
If the example target is $109, the potential gain from $101 is $8 per share, or 2R against the $4 initial risk. The risk/reward guide shows how the frequency and size of actual outcomes determine the average result.
Our raw-line studies gave us an important negative result: the drawing alone did not create dependable odds. The historical panel below therefore reports only support and resistance setups with explicit trade rules. How TradingPal backtests trendlines explains the validation behind that decision.
Weekly is the primary comparison because it provides more observations; monthly supplies a slower secondary view. Results are historical simulations, not forecasts. The track-record metrics guide explains how to judge the full result rather than one headline number.
Historical simulation of the complete named setup, not a generic trend-line result. Weekly is the primary view. Read the methodology →
163 structures found. See example
The day's #10 ranked setup, in your inbox.
Every morning we hand you the highest-ranked breakout structure found in our scan across 2,600+ tickers — Free.
See the full offeringRead these limits with the table below.
The sample, instrument scope and dates belong to this exact setup book. Extreme drawdowns remain visible rather than being hidden.
| View | Scope | Trades | Win rate | Average trade | Profit factor | Max drawdown |
|---|---|---|---|---|---|---|
| Weekly | 598 symbols | 6,728 | 34.5% | +3.03R | 2.11 | 100.0% |
| Monthly | 514 symbols | 2,844 | 44.2% | +9.63R | 5.28 | 74.0% |
Backtest window: 2021-12-06 to 2026-07-13. Data snapshot: 7/23/2026. Historical results can differ from live fills and do not predict future performance.
There is no universal best entry. A level touch, confirmation close or retest can each be tested, but the chosen rule must remain consistent.
Beyond the structure that invalidates the setup, with position size adjusted to keep the planned account risk consistent.
Yes, when anchor selection, qualification, entry, stop and exit rules are explicit enough to reproduce without hindsight.
Changing anchors changes the candidate set. A valid test freezes the line-selection rule before future outcomes are evaluated.
The Support trendlines strategy uses a planned entry above a qualifying support line on weekly or monthly charts.
The Resistance trendlines strategy tests ETF trades near weekly or monthly resistance.
A setup’s trade history and an account’s return answer different questions.
Open the screener to compare current setups, their visible lines and their historical track records.
Explore the screener →Educational content, not investment advice. Backtests are historical simulations and do not predict the next trade.