A trading idea, tested
Why buying a breakout late can erase most of the reward
The stock is moving in the right direction. Why might buying it now be a much worse trade than buying at the breakout?

The short answer
A rising stock can still be a worse trade at a higher price. Among the breakouts that had already moved away from their entry, buying at the next session’s close left much less average reward for the risk taken. Price and timing mattered even when plenty of trades still finished as winners.
Daily-chart breakouts across several pattern families · 157 symbols · July 2026 study. Study recorded .The stock is going up. Why might buying now be worse?
Imagine a planned entry at $50, a safety-exit reference at $48, and a later sale at $54. Buying at $50 gives you $4 of profit against $2 of planned risk. Now imagine missing that entry and buying at $53. The same sale gives you only $1 of profit, while the distance to the same safety exit has grown to $5.
The stock still rose after both purchases. But the second buyer paid more for much less room to profit. That is the problem a chart full of winning trades can hide.
Illustrative · how the idea works
Same exit. A very different bargain.
Original entry: $50
Later entry: $53
The bullish pennant video uses this idea to explain chasing a breakout. The study behind the example covered several pattern families, so the result belongs to that broader group.
We changed the entry price while keeping the exit plan fixed
The study followed 17,888 completed simulated breakouts across 157 stocks and funds. It looked at where price stood after the original entry and asked what a later purchase would have earned with the same stop reference and final exit.
The headline comparison focuses on 5,870 trades that had moved in the intended direction by more than three-tenths of their original planned risk. In a trade with $2 of planned risk per share, that means a move of more than 60 cents. This is an example of the measuring rule, not a universal limit for buying late.
For this comparison, “one day later” means the close of the next trading session after the entry session. Trades already closed by then were excluded. The study did not test buying at the close of the breakout session itself.
Illustrative · how the idea works
“Later” means the following session’s close
We also checked trades that were still close to their entry. That helps separate being late on the clock from being late after the price has already run away.
What happened?
In the fast-moving group, the original entries averaged about $78 per $100 of planned risk. Buying at the next session’s close averaged about $5 per $100 of the larger, late-entry risk. The drop was about 94%. The chance of a winning trade fell much less—from about 60 in 100 to about 55 in 100.
Source: TradingPal’s July 15, 2026 breakout-entry-window study and its collection script. The fast-moving comparison spans several pattern families; it is not a pennant-only result.
See the exact figures and download the table
| Group | Average result | Winning trades | Trades |
|---|---|---|---|
| At the original entry | 0.775R | 59.8% | 5,870 |
| At the next session’s close | 0.05R | 54.8% | 5,870 |
Same 5,870 fast-moving trades; original entry versus next-session close. Dollar labels put each entry on its own $100 planned-risk scale. Historical simulation, before costs.
| Group | Average result | Trades |
|---|---|---|
| Near-entry group, original entry | 0.222R | 10,198 |
| Near-entry group, next-session close | 0.18R | 10,198 |
A separate group of 10,198 trades remained near the original entry. These averages support a smaller late-entry penalty in that group. Do not combine its results with the fast-moving group.
Source: TradingPal’s July 15, 2026 breakout-entry-window study and its collection script. The fast-moving comparison spans several pattern families; it is not a pennant-only result.
Download summary results (CSV) ↓The price you pay is part of the trade
The fast-moving breakouts were not simply bad stocks. From their original entries, they were a strong group in this study. The problem was paying a higher price for the same remaining journey while keeping the old safety exit farther away.
Plenty of late entries still won. That is why the decline from roughly $78 to $5 per $100 of planned risk matters: knowing how often you win is not enough to tell you whether those wins compensate for the risk.
The result was less severe when price stayed near the entry. That separate group’s average fell from about $22 to $18 per $100 of planned risk. A missed entry did not have the same consequence in every chart.
Return to the $50 plan. At $53, you need to evaluate the trade again. The original result does not automatically follow you to the new price. Changing the stop or exit could produce a different answer; this test deliberately kept them fixed.
What this study cannot tell us
The “about 94%” finding applies to the selected fast-moving group across several patterns, not all late purchases or pennants alone. The calculation gives each entry its own risk denominator. It measures reward for planned risk, not a 94% loss of invested money.
Read all study limitations
- These are historical simulations, not actual customer trades or papers reviewed by independent academic experts. Prices, trading costs and future market conditions can produce different results.
- Several trades can come from the same stock or the same market period. They are not independent coin flips. A large trade count does not turn one historical comparison into a promise about the future.
- The historical universe does not fully represent companies that failed or disappeared. Daily price summaries also cannot show every move within a trading session, and modeled entries or exits may be unavailable in practice.
- No out-of-sample split or transaction costs were included. The selected historical pattern geometry was not freshly reconstructed at every old decision point.
- The day-one groups exclude trades that had already exited. Moving the stop, changing the exit or sizing a real account differently could change the answer.
- The video’s shorthand should not be read as a same-session-close test, a pennant-only result, or a 94% decline in an account balance.
For readers who want to check the work
How the study was done, sources and download
- Population
- 17,888 resolved daily-chart trades from every fourth symbol in a 628-symbol research universe: 157 symbols, using the cached history available in July 2026. Exact endpoints differ by symbol.
- Timing
- The collection script uses entry_index + 1 for day one: the following trading session’s close. Some video wording says the first day’s close; this article follows the explicit script timing.
- Selection
- Fast-moving group: signed gain above 0.3 times original risk at that close, with the original trade still open. Near-entry comparison: absolute distance at most 0.3 times original risk.
- Outcome
- Original modeled stop and exit price held fixed. Late R divides remaining price gain by the distance from the later entry to the original stop, so it changes both numerator and denominator.
- Evidence
- Dated result report plus collection and aggregation scripts. This edition transcribes saved aggregate figures; original observation rows were not recovered or rerun for publication.
Source: TradingPal’s July 15, 2026 breakout-entry-window study and its collection script. The fast-moving comparison spans several pattern families; it is not a pennant-only result.
Watch the bullish pennant episode →
Download methods and limitations (text) ↓Cite this research
Use the article link so readers can see the comparison and its limitations. Describe these as historical simulated results, naming the comparison and its scope. The figures do not predict future returns.
TradingPal Research (2026-09-10). Why buying a breakout late can erase most of the reward Version 1.0. Historical study recorded 2026-07-15. https://tradingpal.io/learn/research/breakout-late-entry-study
Questions about the research? Contact TradingPal Research.
Publication and revision record
Version 1.0 · September 10, 2026. First article edition of the study recorded July 15, 2026. The report uses fixed figures; nightly product updates do not change them. Corrections will be dated and explained here.
Keep learning

Bullish pennant
A bullish pennant forms when a sharp rally pauses in a small, narrowing range.

Risk/reward & R-multiples
A trade’s entry, safety exit and target let you compare its planned loss with its potential gain.
What is backtesting?
Backtesting applies a trading rule to historical prices and records the simulated outcomes.
Another question we tested

Original research ·
Do more touches make a bullish pennant a better trade?
Extra touches did not improve the average trade. The four-touch group came out ahead.
Read the study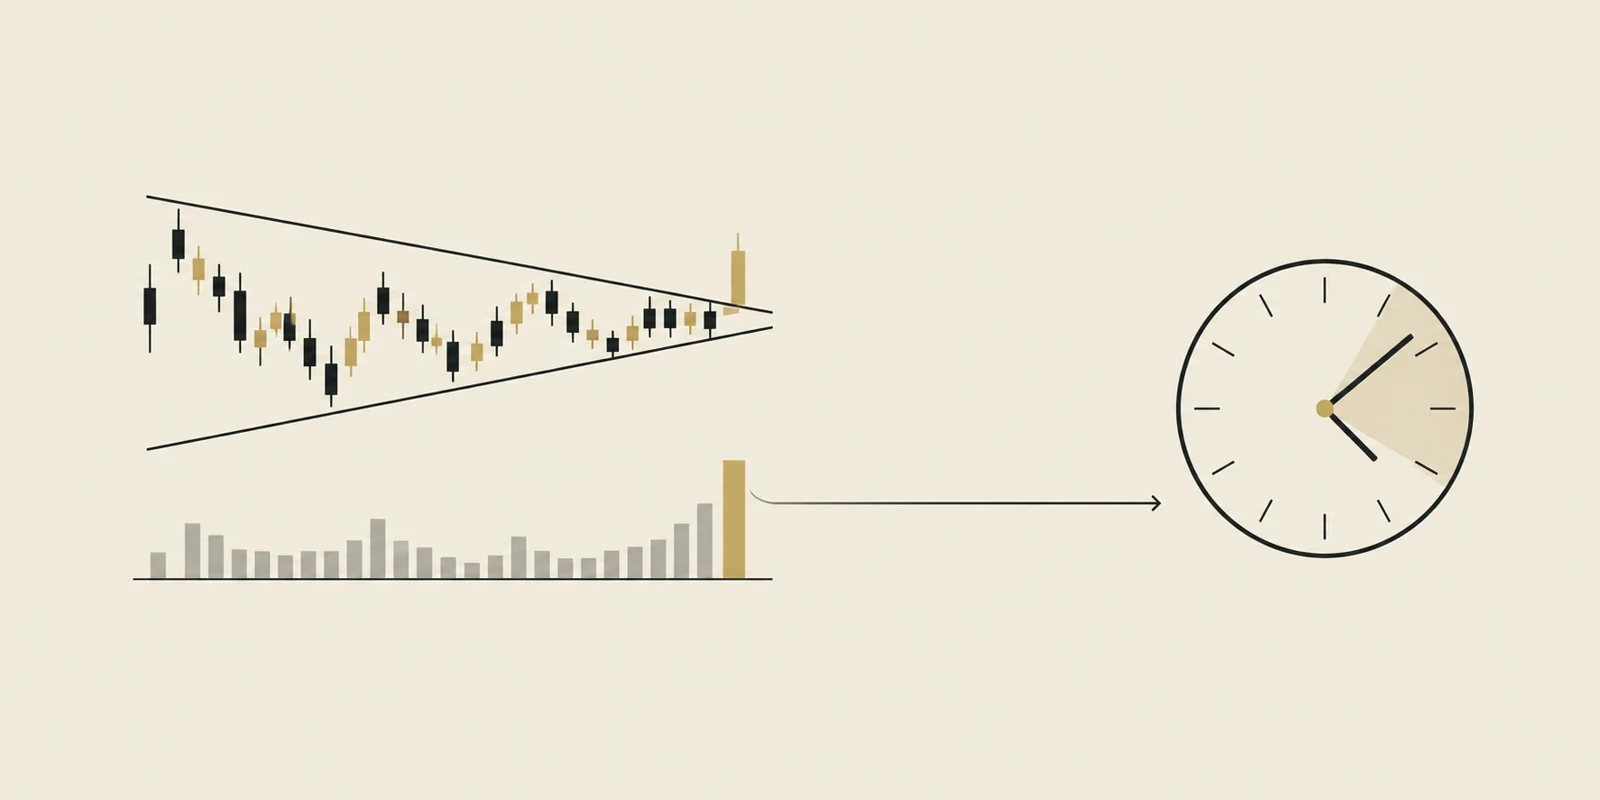
Original research ·
Does volume matter before a breakout?
High volume in the completed breakout bar looked favorable. Evidence for volume known before entry was weaker.
Read the studyEducational research, not investment advice. Historical observations do not predict the next trade. TradingPal publishes this research and sells trading software.