A trading idea, tested
Does a tighter falling wedge make a better trade?
A neat, narrow wedge looks easier to trust. We tested what happened when we removed the looser-looking ones.

The short answer
A tighter shape can look like a stronger signal. But removing the confirmed loose wedges made this simulated account grow more slowly, with little change in its largest decline. Being pickier about the drawing did not improve the whole strategy in this test.
Daily-chart falling wedges · 1,149 historical trades · September 2026 snapshot. Study recorded .Why does a tighter wedge look more promising?
Picture a stock making lower highs and lower lows. Draw a line above those highs and another below the lows. If the two lines come closer together as they slope down, you have a falling wedge.
Some wedges narrow dramatically. Others still have a fairly wide gap at the end. The tight one can feel more decisive, like a spring being squeezed. It is tempting to believe that keeping only those neat examples will produce better trades.
Illustrative · how the idea works
How much room is left between the lines?
Loose: $10 gap becomes $6
Tighter: $10 gap becomes $3
We tested the consequence of that choice. If you take away the looser shapes, does the account actually do better?
We removed the loose shapes, then ran the account again
We measured the gap between the two boundaries at the start and at the end of each wedge. A shape counted as loose when more than half its starting width remained. A wedge starting $10 wide and ending $6 wide would be loose; one ending $3 wide would be tighter. Both can still be valid wedges.
The September snapshot contained 1,149 historical falling-wedge trades. We could verify the original shape for 1,080 of them: 264 were loose and 816 were tighter. For 69, the saved information did not allow a confident match. We kept those 69 in both versions of the account.
That gave us a clean question: what changes when we remove only the 264 confirmed loose wedges? The other version still had the same money limits and trade-management rules. It simply had fewer opportunities to choose from.
Illustrative · how the idea works
Remove only the shapes we can verify as loose
We simulated an account because a list of trades is not an account. You may be able to afford only some of the trades arriving together. Removing one opportunity can change which others you take. The baseline account actually executed 697 of the 1,149 available trades.
What happened?
With all the eligible wedges available, the example account grew at an annualized rate of about 14.5%. After we removed the confirmed loose ones, it grew at about 10.7%. Its largest decline stayed close to 27% in both versions. The cleaner-looking selection gave up growth without much relief from that decline.
Source: TradingPal’s September 10, 2026 current-cohort falling-wedge refresh, frozen ledger 905 / manifest 1323. This replaces the older shape comparison used in earlier episode drafts.
See the exact figures and download the table
| Group | Annualized growth | Largest realized decline | Available trades |
|---|---|---|---|
| All eligible wedges | 14.5445% | 27.5019% | 1,149 |
| Confirmed loose wedges removed | 10.726% | 27.2297% | 885 |
Annualized growth means the steady yearly rate that would produce the same total growth over the test. Actual years were uneven. These are simulated account results, not annual promises.
| Group | Average result | Winning trades | Trades |
|---|---|---|---|
| Confirmed loose | 0.4341441386R | 55.303% | 264 |
| Confirmed tighter | 0.3373376328R | 41.299% | 816 |
| Shape unverified | 0.0539386943R | 37.6812% | 69 |
Trade-level summaries, before portfolio selection. The 69 unverified shapes stay in both account runs; they are not classified as tight. R measures profit or loss against original planned risk.
Source: TradingPal’s September 10, 2026 current-cohort falling-wedge refresh, frozen ledger 905 / manifest 1323. This replaces the older shape comparison used in earlier episode drafts.
Download summary results (CSV) ↓A tidier shortlist did not make a better account
The account with the looser wedges removed grew more slowly. And its worst decline from an earlier high was almost unchanged. The filter did not deliver the hoped-for bargain of a smoother ride for the opportunities it gave up.
We also varied how the simulation chose between competing opportunities. Across 25 paired runs, removing the loose wedges reduced growth every time. This checks whether one fortunate ordering drove the result; it does not create 25 independent histories.
The loose group also won more often in this snapshot. Its average trade result was higher, but that gap was too uncertain to establish a dependable advantage. The more useful finding is the direct account comparison: this particular shape filter hurt the tested strategy.
Return to the two drawings. You may prefer the narrow one visually, but appearance alone is not a good reason to discard the wider one. A stricter rule earns its place by improving the results that matter, including the whole account.
This does not mean every loose wedge is attractive or that looser is always better. It means that this cutoff, applied to this historical set under these rules, removed useful opportunities. A different entry, market period or cost assumption could change the answer.
What this study cannot tell us
This is a historical simulation of one fixed shape filter. The groups were not randomly assigned, and the same past market was reused for all 25 runs. We retained unverified shapes in both versions so that missing geometry did not quietly become a vote for tighter wedges.
Read all study limitations
- These are historical simulations, not actual customer trades or papers reviewed by independent academic experts. Prices, trading costs and future market conditions can produce different results.
- Several trades can come from the same stock or the same market period. They are not independent coin flips. A large trade count does not turn one historical comparison into a promise about the future.
- The historical universe does not fully represent companies that failed or disappeared. Daily price summaries also cannot show every move within a trading session, and modeled entries or exits may be unavailable in practice.
- The cutoff was applied retrospectively; this is not an independent future-period validation. Changes to entries, exits, fees or available capital may change the filter’s effect.
- Available-trade counts are not executed account-trade counts. The reported maximum drawdown uses the study’s realized-equity convention and may understate losses visible while positions remain open.
For readers who want to check the work
How the study was done, sources and download
- Snapshot
- Ledger 905 / manifest 1323, generated September 10, 2026 at 09:36:33 UTC. Typed portfolio method portfolio_v1_typed_exact_v6_entry_policy_er2p5_floor_one_open. Falling-wedge trade dates October 13, 2006 through September 9, 2026; 770 family symbols within a 2,569-symbol source universe.
- Shape rule
- Ending boundary width divided by starting boundary width greater than 0.50 is loose. Original geometry verified for 1,080 of 1,149 rows. Of 69 unknowns, 66 lacked a matched original snapshot digest and three had ambiguous execution matches.
- Account comparison
- All 1,149 opportunities versus 885 after excluding 264 confirmed loose rows. Unknowns remain in both. Existing sizing and capacity rules were retained; 25 paired allocation-jitter seeds were tested.
- Robustness
- All 25 paired growth differences were negative. Median annualized-growth change: −3.5378187 percentage points; range −4.9520 to −2.5614. The displayed representative run has a −3.8185-point change; it is not the seed median.
- Trade-level uncertainty
- Loose-minus-tighter mean payoff difference +0.0968R; reported interval −0.1300 to +0.3352R. This does not establish a reliable payoff edge for loose shapes. No additional transaction-cost stress test was run.
- Evidence
- Frozen machine-readable result and analysis scripts retained. Source SHA-256: 5cc9e63a7ed9e9a7c7c2fc7cb0e930f066164dd97503aa8676c6b2b57f052c68. This edition uses the current refresh, not the superseded 9,991-row shape study.
Source: TradingPal’s September 10, 2026 current-cohort falling-wedge refresh, frozen ledger 905 / manifest 1323. This replaces the older shape comparison used in earlier episode drafts.
Download methods and limitations (text) ↓Cite this research
Use the article link so readers can see the comparison and its limitations. Describe these as historical simulated results, naming the comparison and its scope. The figures do not predict future returns.
TradingPal Research (2026-09-10). Does a tighter falling wedge make a better trade? Version 1.0. Historical study recorded 2026-09-10. https://tradingpal.io/learn/research/falling-wedge-tightness-study
Questions about the research? Contact TradingPal Research.
Publication and revision record
Version 1.0 · September 10, 2026. First article edition of the study recorded September 10, 2026. The report uses fixed figures; nightly product updates do not change them. Corrections will be dated and explained here.
Keep learning

Falling wedge
A falling wedge has two downward-sloping boundaries that draw closer together.
What is backtesting?
Backtesting applies a trading rule to historical prices and records the simulated outcomes.

Risk/reward & R-multiples
A trade’s entry, safety exit and target let you compare its planned loss with its potential gain.
Another question we tested

Original research ·
Can holding through a pullback hurt the whole account?
Holding longer improved average trade payoff, but the older multi-pattern account grew more slowly.
Read the study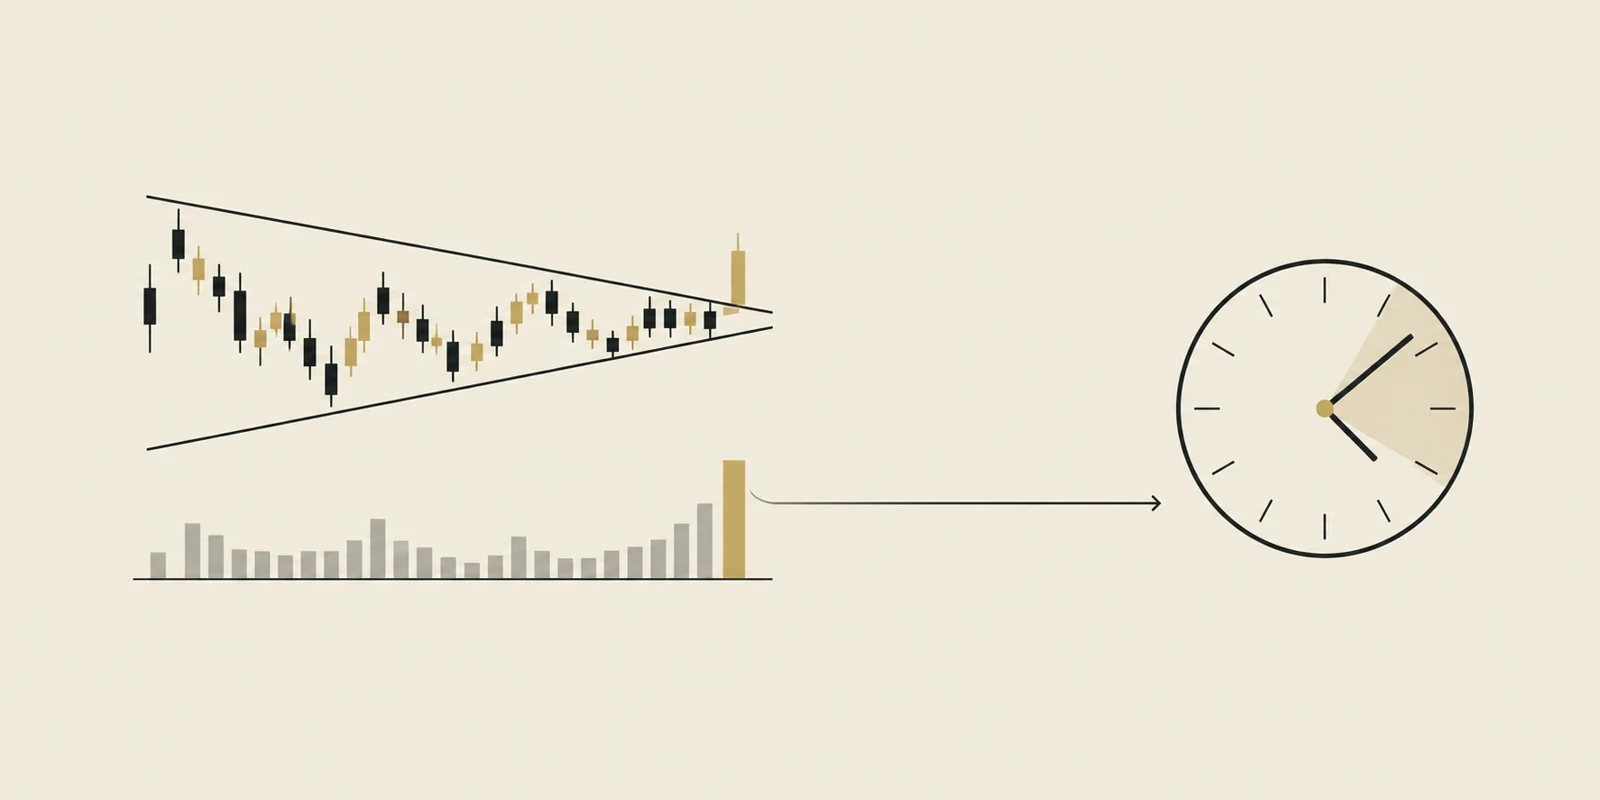
Original research ·
Does volume matter before a breakout?
High volume in the completed breakout bar looked favorable. Evidence for volume known before entry was weaker.
Read the studyEducational research, not investment advice. Historical observations do not predict the next trade. TradingPal publishes this research and sells trading software.