A trading idea, tested
Does volume matter before a breakout?
A busy breakout can look convincing. I checked whether volume helped identify better trades—and whether the useful information was available in time.
The short answer
High volume in a completed breakout bar went with better average returns in this sample. High volume the previous day gave a weaker positive clue. Neither finding establishes that waiting for high volume would improve a live trade: the strongest measurement includes trading that happened after the price crossed the entry level.
11,240 historical simulated bullish stock trades across 1,824 symbols, 2016–2025. Study recorded .Why does a busy breakout look more convincing?
Imagine a stock has been moving between $95 and $100. It reaches $100, falls back, and tries again. Traders call this a consolidation: a period when price moves within a relatively confined shape. A breakout is the move beyond its boundary.
Now imagine price crosses $100 at 10:12 a.m. Many traders want to see a burst of activity alongside that move. Trading volume counts the shares that changed hands. A larger number can make the breakout feel better supported.
Illustrative · how the measurement works
Price crosses the boundary. Volume counts the activity.
There is a related belief about the days before the move: volume should fall while the pattern forms, then increase at the breakout. That sounds plausible. But low volume yesterday, low volume for a week, and a busy breakout today describe different things.
I checked each measurement separately, then looked at combinations. The question was whether those conditions identified better historical trades—and whether a trader could know the condition before entering.
Compare the same trades, then check the clock
I used saved outcomes for 11,240 bullish consolidation trades across 1,824 stock symbols from 2016 through 2025. The archive includes triangles, pennant squeezes and range squeezes. It is a selected historical sample of trades the model admitted and resolved, not every breakout in the market.
I kept each trade’s original entry and exit unchanged. For each volume measurement, I sorted those trades into low, normal and high groups, then compared their average returns, including losses. That lets the groups differ by the volume measurement without silently changing the trade rules between them.
Volume needs a reference. For yesterday’s volume, I used the average over the 20 sessions before yesterday. For the previous 5-session average, I used the 20 sessions before that 5-session window. Low means no more than 75% of the reference; high starts at 150%; normal is in between. These are study definitions, not universal thresholds.
Illustrative · how the measurement works
Compared with what?
Below 150,000Between 0.75× and 1.5×
For volume during the breakout, I located the first 30-minute interval whose high reached the entry trigger. Price did not have to close above the trigger. I compared that interval’s total volume with the average in the same clock slot over 20 earlier usable full sessions.
Illustrative · how the measurement works
What could I know at 10:12?
Return means the percentage change from the saved purchase price to the saved sale price, after allowing a 0.25% worse price at each end. An average includes both winning and losing trades. It does not describe the growth of an account holding many trades.
What happened?
The previous day and the completed breakout bar both showed higher average returns in their high-volume groups. The evidence was stronger for the completed bar. Read the 2 comparisons separately: the first uses all 11,240 trades; the second uses the 11,032 with verified intraday measurements. The other 208 remain in the daily comparison; the methods account for each missing intraday measurement.
Average return per trade (%)
High averaged 3.46%, versus 2.37% for low. The high-minus-low difference only narrowly clears the ordinary 95% check and does not clear the stricter adjustment for the 10 comparisons. High versus normal does not clearly separate even at 95%.
Source: TradingPal’s corrected October 8, 2026 breakout-volume study and disclosed high-versus-low follow-up. Daily archived outcomes are held fixed. Group intervals use 2,000 bootstrap draws per clustering; direct follow-up comparisons use 10,000.
Average return per trade (%)
High averaged 3.34%, versus 2.07% for low. The high-minus-low difference remains positive after adjustment for the 10 comparisons. This describes the completed bar; it does not establish a volume rule that could be acted on at the earlier crossing.
Source: TradingPal’s corrected October 8, 2026 breakout-volume study and disclosed high-versus-low follow-up. Daily archived outcomes are held fixed. Group intervals use 2,000 bootstrap draws per clustering; direct follow-up comparisons use 10,000.
See the exact figures and download the table
| Group | Average return / trade | 95% lower bound | 95% upper bound | Trades | Before price allowance | Average R |
|---|---|---|---|---|---|---|
| Low | 2.3720% | 1.6391% | 3.0808% | 3,447 | 2.8852% | 0.3604R |
| Normal | 2.7198% | 2.0734% | 3.3655% | 6,544 | 3.2346% | 0.4061R |
| High | 3.4599% | 2.3076% | 4.5436% | 1,249 | 3.9785% | 0.4296R |
All 11,240 trades. Yesterday’s volume divided by the average over the preceding 20 sessions. Original simulated entries and exits are unchanged. Averages include losses and a 0.25% adverse price allowance on each side. Whiskers show 95% intervals for each average, not the range of individual trades.
| Group | Average return / trade | 95% lower bound | 95% upper bound | Trades | Before price allowance | Average R |
|---|---|---|---|---|---|---|
| Low | 2.0693% | 1.3254% | 2.7941% | 2,886 | 2.5809% | 0.3465R |
| Normal | 2.6791% | 2.0838% | 3.2455% | 4,394 | 3.1938% | 0.4057R |
| High | 3.3358% | 2.4526% | 4.1794% | 3,752 | 3.8538% | 0.4341R |
11,032 trades with verified intraday measurements. Each 30-minute total is compared with the same clock slot over 20 earlier usable full sessions. Its final volume is known at the bar’s end. Original simulated entries and exits are unchanged. Averages include losses and a 0.25% adverse price allowance on each side. Whiskers show 95% intervals for each average, not the range of individual trades.
| Group | Average return / trade | 95% lower bound | 95% upper bound | Trades | Before price allowance | Average R |
|---|---|---|---|---|---|---|
| Low | 2.6460% | 1.8458% | 3.4456% | 2,918 | 3.1606% | 0.4108R |
| Normal | 2.6946% | 1.9966% | 3.3516% | 7,536 | 3.2093% | 0.3965R |
| High | 2.8858% | 1.6129% | 4.2576% | 786 | 3.4015% | 0.3184R |
11,240 trades. Mean volume in the 5 sessions before entry divided by the mean of the preceding 20 sessions; the windows do not overlap.
| Group | Average return / trade | 95% lower bound | 95% upper bound | Trades | Before price allowance | Average R |
|---|---|---|---|---|---|---|
| Decreasing | 2.7908% | 1.9626% | 3.6091% | 3,956 | 3.3060% | 0.4144R |
| Flat | 2.6333% | 1.9952% | 3.2885% | 6,968 | 3.1477% | 0.3850R |
| Increasing | 2.8699% | 1.4095% | 4.2915% | 316 | 3.3856% | 0.3626R |
11,240 trades. Second-half mean volume divided by first-half mean volume, before entry. Decreasing ≤0.75; flat >0.75 and <1.5; increasing ≥1.5. Flat is a broad middle band.
| Group | Average return / trade | 95% lower bound | 95% upper bound | Trades | Before price allowance | Average R |
|---|---|---|---|---|---|---|
| Low | 3.1482% | 2.3019% | 4.0750% | 1,626 | 3.6652% | 0.4699R |
| Normal | 1.8894% | 1.1246% | 2.6360% | 2,067 | 2.4001% | 0.2467R |
| High | 2.6065% | 1.5129% | 3.7318% | 668 | 3.1208% | 0.3461R |
4,361 later crossings. Cumulative completed-bar volume before the crossing bar, compared with the same clock window over 20 earlier full sessions. This can lag the crossing by up to 30 minutes.
| Group | Average return / trade | 95% lower bound | 95% upper bound | Trades | Before price allowance | Average R |
|---|---|---|---|---|---|---|
| Low | 2.4567% | 1.7195% | 3.1664% | 3,373 | 2.9703% | 0.3751R |
| Normal | 2.7529% | 2.0951% | 3.3942% | 6,425 | 3.2679% | 0.4069R |
| High | 3.4734% | 2.3305% | 4.5455% | 1,234 | 3.9920% | 0.4308R |
Matched descriptive subset with unchanged entries and exits. These averages differ from the full 11,240-trade panel because 208 intraday measurements are unavailable.
| Group | Average return / trade | 95% lower bound | 95% upper bound | Trades | Before price allowance | Average R |
|---|---|---|---|---|---|---|
| Low | 2.6994% | 1.8831% | 3.5003% | 2,852 | 3.2142% | 0.4156R |
| Normal | 2.7314% | 2.0235% | 3.3777% | 7,411 | 3.2463% | 0.4008R |
| High | 3.0154% | 1.7122% | 4.4137% | 769 | 3.5318% | 0.3323R |
Matched descriptive subset with unchanged entries and exits. These averages differ from the full 11,240-trade panel because 208 intraday measurements are unavailable.
| Group | Average return / trade | 95% lower bound | 95% upper bound | Trades | Before price allowance | Average R |
|---|---|---|---|---|---|---|
| Decreasing | 2.8657% | 2.0456% | 3.6786% | 3,880 | 3.3813% | 0.4237R |
| Flat | 2.6625% | 2.0253% | 3.3210% | 6,844 | 3.1771% | 0.3871R |
| Increasing | 2.9829% | 1.5836% | 4.3683% | 308 | 3.4991% | 0.3838R |
Matched descriptive subset with unchanged entries and exits. These averages differ from the full 11,240-trade panel because 208 intraday measurements are unavailable.
| Group | Average return / trade | 95% lower bound | 95% upper bound | Trades | Before price allowance | Average R |
|---|---|---|---|---|---|---|
| Low / Low | 1.7163% | 0.8275% | 2.6125% | 1,336 | 2.2261% | 0.2827R |
| Low / Normal | 2.7733% | 1.8399% | 3.7135% | 1,287 | 3.2884% | 0.4018R |
| Low / High | 3.2325% | 2.0686% | 4.4701% | 750 | 3.7500% | 0.4936R |
| Normal / Low | 2.3879% | 1.5958% | 3.1890% | 1,427 | 2.9011% | 0.4182R |
| Normal / Normal | 2.6089% | 1.9381% | 3.2512% | 2,734 | 3.1233% | 0.4034R |
| Normal / High | 3.1567% | 2.2353% | 4.0726% | 2,264 | 3.6738% | 0.4042R |
| High / Low | 2.2070% | -0.5935% | 5.3561% | 123 | 2.7193% | 0.2069R |
| High / Normal | 2.8685% | 1.5984% | 4.0929% | 373 | 3.3841% | 0.4359R |
| High / High | 3.9902% | 2.5358% | 5.6304% | 738 | 4.5114% | 0.4655R |
All 9 groups on the same 11,032 trades. First label: earlier volume; second: completed breakout-bar volume. These combinations are descriptive, not additional confirmed trading rules.
| Group | Average return / trade | 95% lower bound | 95% upper bound | Trades | Before price allowance | Average R |
|---|---|---|---|---|---|---|
| Low / Low | 2.0143% | 1.0146% | 3.0789% | 1,012 | 2.5256% | 0.3077R |
| Low / Normal | 2.8122% | 1.9281% | 3.8300% | 1,102 | 3.3276% | 0.4692R |
| Low / High | 3.4704% | 2.1892% | 4.7823% | 738 | 3.9891% | 0.4835R |
| Normal / Low | 2.0104% | 1.2575% | 2.7764% | 1,726 | 2.5218% | 0.3697R |
| Normal / Normal | 2.6324% | 1.9402% | 3.3249% | 3,025 | 3.1469% | 0.3889R |
| Normal / High | 3.3117% | 2.3491% | 4.2953% | 2,660 | 3.8296% | 0.4346R |
| High / Low | 3.1314% | 1.0080% | 5.2313% | 148 | 3.6484% | 0.3406R |
| High / Normal | 2.6585% | 1.0671% | 4.3625% | 267 | 3.1731% | 0.3336R |
| High / High | 3.2361% | 1.3048% | 5.2783% | 354 | 3.7536% | 0.3278R |
All 9 groups on the same 11,032 trades. First label: earlier volume; second: completed breakout-bar volume. These combinations are descriptive, not additional confirmed trading rules.
| Group | Average return / trade | 95% lower bound | 95% upper bound | Trades | Before price allowance | Average R |
|---|---|---|---|---|---|---|
| Decreasing / Low | 1.8725% | 0.9609% | 2.9292% | 1,020 | 2.3831% | 0.3128R |
| Decreasing / Normal | 2.9350% | 2.1233% | 3.7071% | 1,539 | 3.4510% | 0.4727R |
| Decreasing / High | 3.5520% | 2.3130% | 4.8216% | 1,321 | 4.0710% | 0.4524R |
| Flat / Low | 2.1353% | 1.2397% | 2.9932% | 1,757 | 2.6472% | 0.3623R |
| Flat / Normal | 2.5286% | 1.8860% | 3.1818% | 2,741 | 3.0425% | 0.3690R |
| Flat / High | 3.2137% | 2.3408% | 4.0503% | 2,346 | 3.7311% | 0.4266R |
| Increasing / Low | 2.8469% | 0.5928% | 5.2582% | 109 | 3.3625% | 0.4063R |
| Increasing / Normal | 2.8431% | 0.4724% | 5.4437% | 114 | 3.3586% | 0.3827R |
| Increasing / High | 3.3448% | 0.9390% | 5.8939% | 85 | 3.8628% | 0.3565R |
All 9 groups on the same 11,032 trades. First label: earlier volume; second: completed breakout-bar volume. These combinations are descriptive, not additional confirmed trading rules.
| Group | Difference | 95% lower | 95% upper | 99.5% lower | 99.5% upper |
|---|---|---|---|---|---|
| Previous day: high minus low | 1.0879 pp | 0.0141 pp | 2.1928 pp | -0.4215 pp | 2.7593 pp |
| Previous day: high minus normal | 0.7401 pp | -0.1536 pp | 1.6684 pp | -0.5337 pp | 2.0791 pp |
| Previous 5 sessions: high minus low | 0.2398 pp | -1.1445 pp | 1.6406 pp | -1.6766 pp | 2.3449 pp |
| Previous 5 sessions: high minus normal | 0.1912 pp | -1.0583 pp | 1.4850 pp | -1.5821 pp | 2.1505 pp |
| Completed breakout bar: high minus low | 1.2665 pp | 0.4359 pp | 2.1157 pp | 0.0813 pp | 2.5299 pp |
| Completed breakout bar: high minus normal | 0.6567 pp | 0.0163 pp | 1.3028 pp | -0.2491 pp | 1.6073 pp |
| Earlier completed intraday volume: high minus low | -0.5417 pp | -1.7894 pp | 0.6917 pp | -2.3234 pp | 1.2396 pp |
| Earlier completed intraday volume: high minus normal | 0.7171 pp | -0.3942 pp | 1.8258 pp | -0.8541 pp | 2.2582 pp |
| Previous day: low minus normal | -0.3477 pp | -0.9516 pp | 0.2741 pp | -1.2014 pp | 0.5601 pp |
| Earlier completed intraday volume: low minus normal | 1.2588 pp | 0.3331 pp | 2.2196 pp | -0.0551 pp | 2.6696 pp |
Percentage-point differences in average return per trade. 95% intervals are unadjusted; 99.5% intervals apply a Bonferroni adjustment to these 10 comparisons. They do not undo all earlier exploration. Each interval is the wider envelope of stock-cluster and month-cluster bootstrap intervals.
Source: TradingPal’s corrected October 8, 2026 breakout-volume study and disclosed high-versus-low follow-up. Daily archived outcomes are held fixed. Group intervals use 2,000 bootstrap draws per clustering; direct follow-up comparisons use 10,000.
Download summary results (CSV) ↓What should a trader take from the difference?
High previous-day volume was a tentative positive clue. Its average return was 3.46%, compared with 2.37% for low volume: a gap of 1.09 percentage points. That is a comparison between groups of trades, not an extra 1.09% promised on the next trade.
A sample can make a gap look larger or smaller than it really is. The ordinary 95% interval for this gap ran from about +0.01 to +2.19 percentage points, barely staying above 0. After making the check stricter because I examined several comparisons, the range crossed 0. High versus normal volume was uncertain even under the ordinary check.
The completed breakout bar had stronger support. High volume averaged 3.34%, versus 2.07% for low: a 1.27-point gap. Its ordinary 95% interval ran from about +0.44 to +2.12 points. The interval stayed positive after the adjustment for the 10 follow-up comparisons, although that lower bound was only about +0.08 points.
These statements answer different comparisons. “High looks better than low” does not automatically mean “high clearly beats normal,” or “every setup below high should be rejected.” The direct tests compare the differences themselves; overlap between the separate chart whiskers is not the test.
Measured differences · high minus low
Check the difference itself
Previous day: +1.09 points
95% (ink): +0.01 to +2.19 points.
Adjusted (gold): −0.42 to +2.76 points.
Completed breakout bar: +1.27 points
95% (ink): +0.44 to +2.12 points.
Adjusted (gold): +0.08 to +2.53 points.
Low volume for a week added little separation
The previous 5-session average was less informative here. Low volume averaged 2.65% per trade, normal 2.69%, and high 2.89%. The direct high-versus-low comparison did not establish a clear advantage. A low-volume week was not a strong reason to prefer a setup in this sample.
Volume declining through the consolidation also had a modest difference: 2.79% for decreasing volume versus 2.63% for the middle group. I split the formation into 2 halves and compared their mean volumes. “Flat” labels the broad middle band, not perfectly unchanged daily activity.
I also kept completed breakout-bar volume high and compared the earlier conditions within that group. Decreasing consolidation volume averaged 3.55%, versus 3.21% for flat volume. Low volume over the previous 5 sessions averaged 3.47%, versus 3.31% for normal. Those smaller combinations remain exploratory; this study does not establish their extra benefit as dependable.
At 10:12, the 10:30 total is still in the future
Return to the stock crossing $100 at 10:12. Its 10:00–10:30 interval may eventually have high volume. But the total includes 18 minutes of trading after the crossing. The high-volume label is fully known at 10:30, not necessarily at 10:12.
That matters because the strongest result is about a completed interval. The volume and the price move are observed together. The study does not establish that volume caused the better outcome, or what would happen if you waited until 10:30 and bought at a different price.
I therefore ran another comparison using only completed intervals before the crossing interval began. In this example, I added volume from the 9:30 open through 10:00 and compared it with the average over that same part of the day in the 20 earlier sessions. It leaves out the partial volume building inside the current interval.
There were 4,361 later breakouts with that earlier snapshot. Low volume averaged 3.15%, normal 1.89%, and high 2.61%. High did not clearly outperform low. This is narrower than saying all real-time volume is useless: the snapshot may be up to 30 minutes behind the actual crossing.
Another 6,671 trades crossed during the opening half-hour, so there was no earlier completed regular-session interval that day. Their entries still count. Finer data would be needed to test what was known inside that opening interval.
A reason to study volume, with the timing kept intact
I would not dismiss volume as irrelevant. High volume yesterday looked favorable against low volume, and a high-volume completed breakout interval had stronger historical support. The previous 5-session average showed much less separation.
But a useful description of a completed move is not automatically an entry rule. At 10:12, the decision must use what is available at 10:12. Testing a rule that waits for volume would need its own entry prices, exits, skipped opportunities and costs.
For now, this research supports paying attention to the volume definition and its timing. It does not support making high volume a universal requirement. The next useful step is a fresh test of a precisely timed rule, rather than choosing whichever historical bar looks tallest.
What this study cannot tell us
These comparisons were explored in a selected historical sample, and the high-versus-low follow-up was chosen after the charts were seen. The completed breakout-bar volume includes information unavailable at the earlier crossing. Neither a large trade count nor a positive confidence interval removes those limits.
Read all study limitations
- The universe is selected and does not fully represent failed or delisted companies. The years were used during system development. Results may differ for an unseen period, a different universe, bearish trades or other patterns.
- The groups contain different trades. Holding each archived outcome fixed prevents an entry-rule mismatch but does not control all differences in stocks, market regimes, volatility or pattern quality. Association does not establish causation.
- The corrected study and the high-versus-low follow-up were conducted after earlier results had been inspected. The multiple-comparison adjustment is limited to 10 listed contrasts and does not eliminate selection from the wider research process.
- Completed breakout-interval volume includes trading after an intrabar crossing. The known-before snapshot omits the current partial interval and all opening-interval entries. Neither measurement is exact volume at the transaction time.
- The 208 unavailable intraday measurements may differ systematically from the available sample. The daily comparison retains them; intraday findings apply to the measured subset.
- Returns are simulated per-trade averages, including losses. They do not model a portfolio’s capital constraints, overlapping holdings or compounding. The fixed price allowance cannot establish achievable live execution.
- Separate stock and month cluster resampling accounts for some dependence but is not a complete model of dependence across both dimensions. Only 120 entry months are represented, and interval endpoints near 0 are sensitive to resampling precision.
- Combination cells are exploratory. A taller bar or an overlapping/non-overlapping pair of mean intervals alone does not establish a reliable difference. The article reports the direct contrast intervals separately.
- TradingPal performed and publishes the research and sells trading software. This report has not been independently peer reviewed.
For readers who want to check the work
How the study was done, sources and download
- Research question
- Do volume conditions distinguish average returns among archived bullish consolidation trades, and when was each condition knowable? This is an observational association study, not a randomized experiment or a prospective live strategy test.
- Population
- 11,240 admitted and resolved bullish stock consolidation trades, 1,824 symbols, entry years 2016–2025. The primary archive retains its original family, admission, deduplication and lifecycle rules. It is not a point-in-time reconstruction of every security or every candidate pattern.
- Entries and exits
- Each row retains the archived trigger/gap entry, structural stop, target and original lifecycle exit. No hourly-close confirmation or next-bar entry is added. A 30-minute high locates the first interval reaching the saved trigger; it does not identify the exact transaction time or prove a live fill. There is no change to entry or exit between volume categories.
- Outcome and price allowance
- Net return (%) = 100 × [(saved exit × 0.9975) / (saved entry × 1.0025) − 1]. This applies 0.25% adverse prices on each side. The raw price return and average R are secondary outputs. The allowance is not a complete model of commissions, spreads, liquidity, market impact, taxes or account capacity.
- Daily-volume definitions
- Previous day: D−1 volume divided by mean volume in the 20 sessions before D−1. Recent: mean volume in the 5 sessions before entry divided by the preceding 20-session mean; disjoint windows. Consolidation trend: second-half mean divided by first-half mean before entry. Daily definitions remain those of the archive.
- Categories
- Low ≤0.75×; normal >0.75× and <1.5×; high ≥1.5×. The same ratio thresholds define decreasing / flat / increasing for consolidation halves. Flat denotes a broad middle band. The completed breakout interval uses the same-clock-slot historical average, not a full-day average.
- Intraday reference
- Massive split-adjusted 30-minute aggregates. Exchange calendar: XNYS, America/New_York, exchange_calendars 4.13.2. Seek 20 usable full sessions within 60 preceding exchange sessions. Skip shortened or incomplete historical sessions individually. Include shortened entry sessions using their actual close.
- Price and symbol checks
- Repository class-share aliases and provider-dated historical ticker identities are used. Prior daily/intraday closes set the median price-scale ratio; each selected prior ratio must be within 2% of that median. The factor is not tuned to force an entry-day crossing. Gaps strictly after the first crossing are allowed.
- Available-before measurement
- Cumulative volume in completed regular-session intervals strictly before the first crossing interval, divided by the mean volume over the identical clock window in the 20 historical sessions. This covers 4,361 later crossings and can lag the crossing by up to 30 minutes. The 6,671 opening-interval crossings have no such snapshot.
- Coverage accounting
- 11,240 = 11,032 verified intraday measurements + 208 unavailable. The 208 comprise 56 entirely absent entry sessions; 25 missing intervals preventing first-crossing identification; 18 daily/intraday trigger disagreements; 66 prior price-scale disagreements; and 43 with fewer than 20 usable reference sessions. All remain in the daily-volume panel.
- Corrections and research sequence
- The earlier hourly-close / next-open experiment was withdrawn. The corrected study retained all original entries and exits, skipped unusable historical sessions individually, and recovered historical symbols. Earlier outcomes had already been seen. An October 8 amendment fixed the corrected rules before calculation; it was not an untouched preregistration. The direct high-versus-low follow-up came after viewing the corrected charts.
- Intervals around group averages
- 2,000 percentile bootstrap resamples clustered by stock and separately by entry month, seed 81028. Use the lower of the 2 lower bounds and higher of the 2 upper bounds as the reported 95% envelope. This is a sensitivity envelope from 2 one-way cluster analyses, not a formal joint two-way cluster estimator; unmodeled dependence may remain.
- Direct differences and multiple comparisons
- 10,000 draws per clustering, seed 81027, for 10 specified follow-up contrasts. Report ordinary 95% intervals and 99.5% intervals, the Bonferroni adjustment for 10 comparisons at a 5% family allowance. This adjustment covers those 10 contrasts; it does not correct every prior research choice or convert exploration into confirmation. Intervals containing 0 are not proof of equivalence.
- Monte Carlo sensitivity
- The prior 4-contrast analysis used 2,000 draws and 98.75% intervals. With 10,000 draws, the known-before low-minus-normal 98.75% lower endpoint moved from approximately −0.009 to +0.083 percentage points. It still crosses 0 under the expanded 10-comparison adjustment (99.5% lower approximately −0.055). Near-zero endpoints should not be treated as stable trading edges.
- Verification and reproducibility
- Checks authenticated all 11,240 saved outcomes, 11,032 first crossings, 14,698 source files and 87 aggregate cells. Selected bootstrap calculations were independently reproduced within this project; this is not an external replication. Public downloads preserve exact summary precision, all 10 follow-up contrasts and source hashes. Licensed source-market responses and the full trade-level archive are not redistributed in this article.
Source: TradingPal’s corrected October 8, 2026 breakout-volume study and disclosed high-versus-low follow-up. Daily archived outcomes are held fixed. Group intervals use 2,000 bootstrap draws per clustering; direct follow-up comparisons use 10,000.
- Download the frozen aggregate evidence and verification record (JSON)
- Massive: custom aggregate bars and empty-interval semantics
- NIST: confidence intervals for differences between means
Cite this research
Use the article link so readers can see the comparison and its limitations. Describe these as historical simulated results, naming the comparison and its scope. The figures do not predict future returns.
TradingPal Research (2026-10-09). Does Volume Matter Before a Breakout? A Study of 11,240 Trades Version 1.0. Historical study recorded 2026-10-08. https://tradingpal.io/learn/research/breakout-volume-study
Questions about the research? Contact TradingPal Research.
Publication and revision record
Version 1.0 · October 9, 2026. First article edition of the study recorded October 8, 2026. The report uses fixed figures; nightly product updates do not change them. Corrections will be dated and explained here.
Keep learning

Bullish pennant
A bullish pennant forms when a sharp rally pauses in a small, narrowing range.
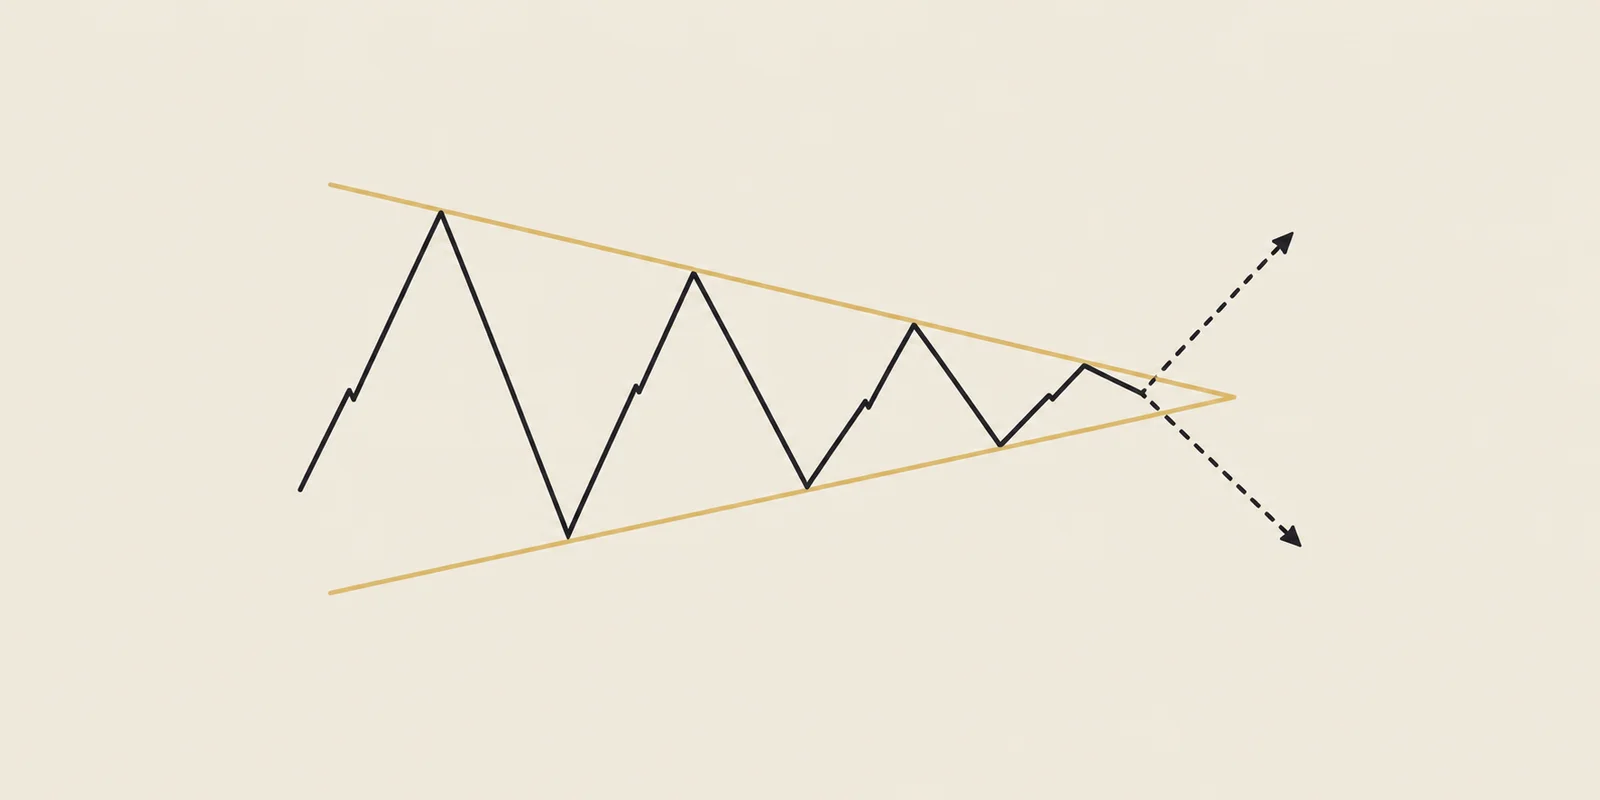
Symmetrical triangle
The swings get smaller, but the next move can go either way.
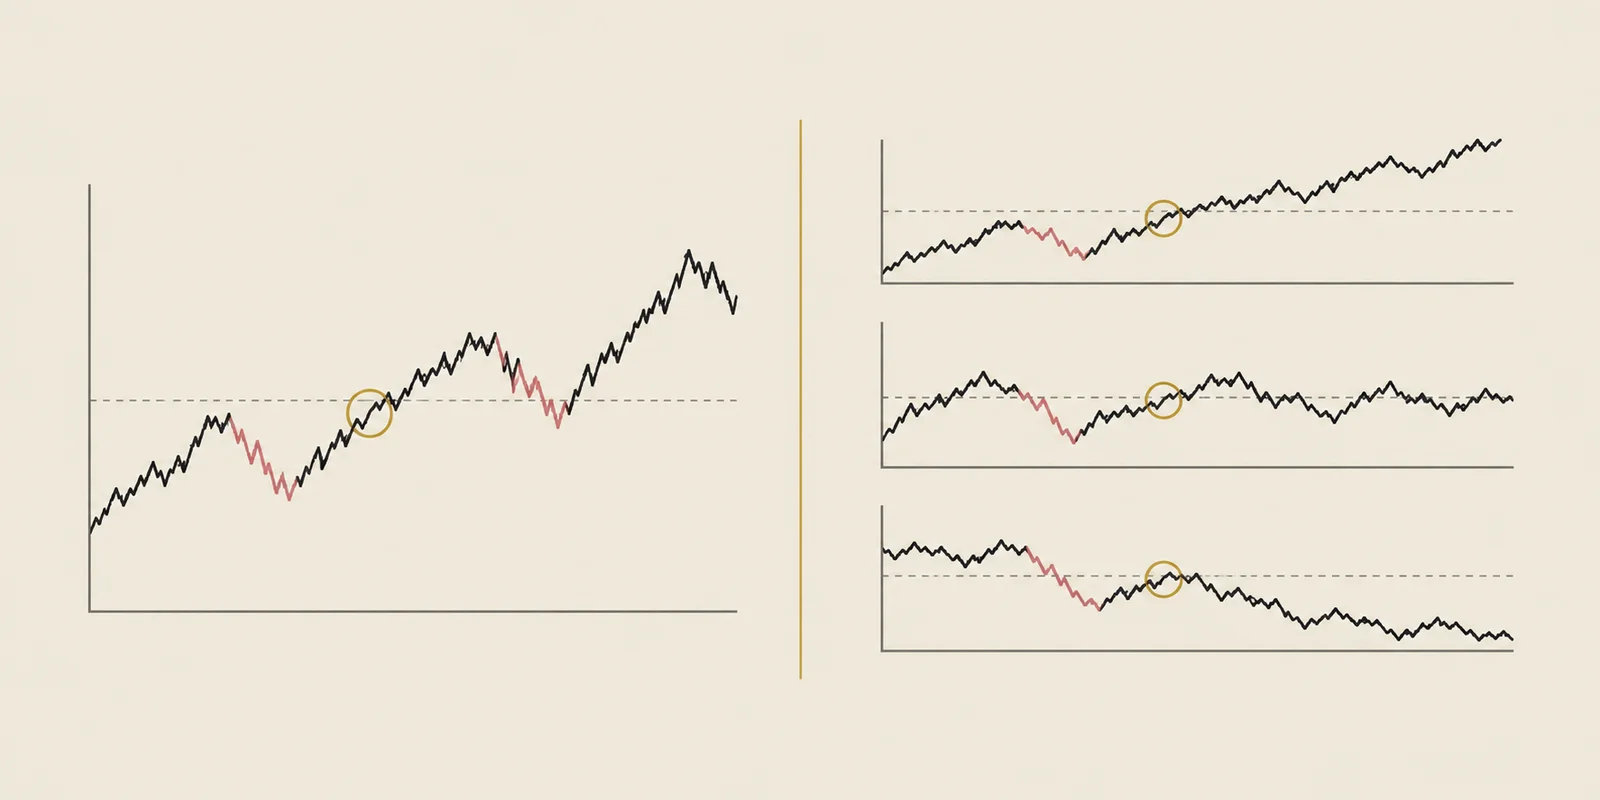
How TradingPal backtests
A setup’s trade history and an account’s return answer different questions.
Another question we tested
Original research ·
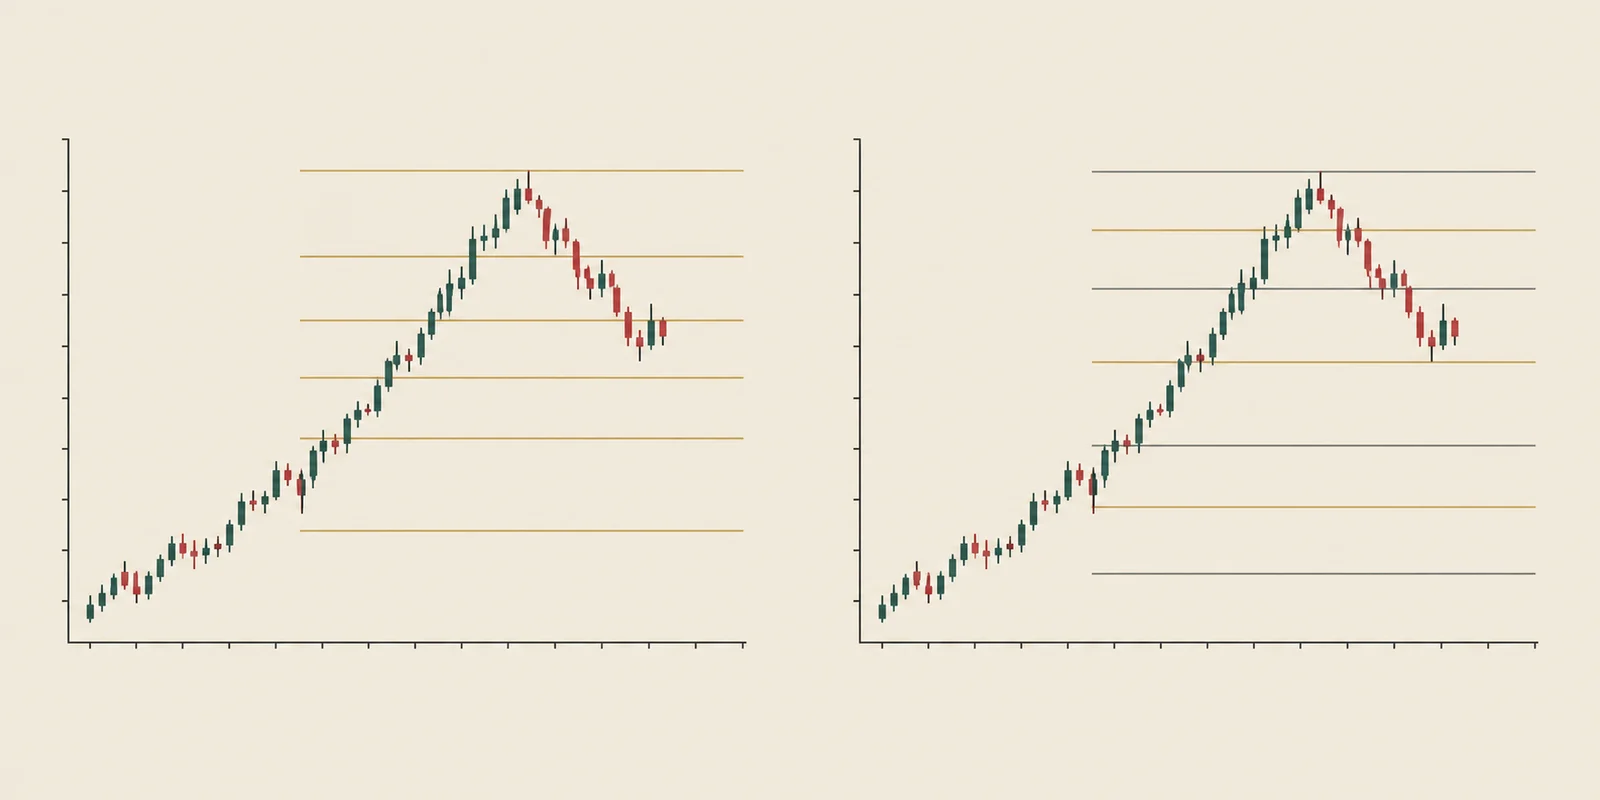
Do Fibonacci levels help predict a bounce?
We moved the lines to different percentages. Prices recovered about as often.
Read the study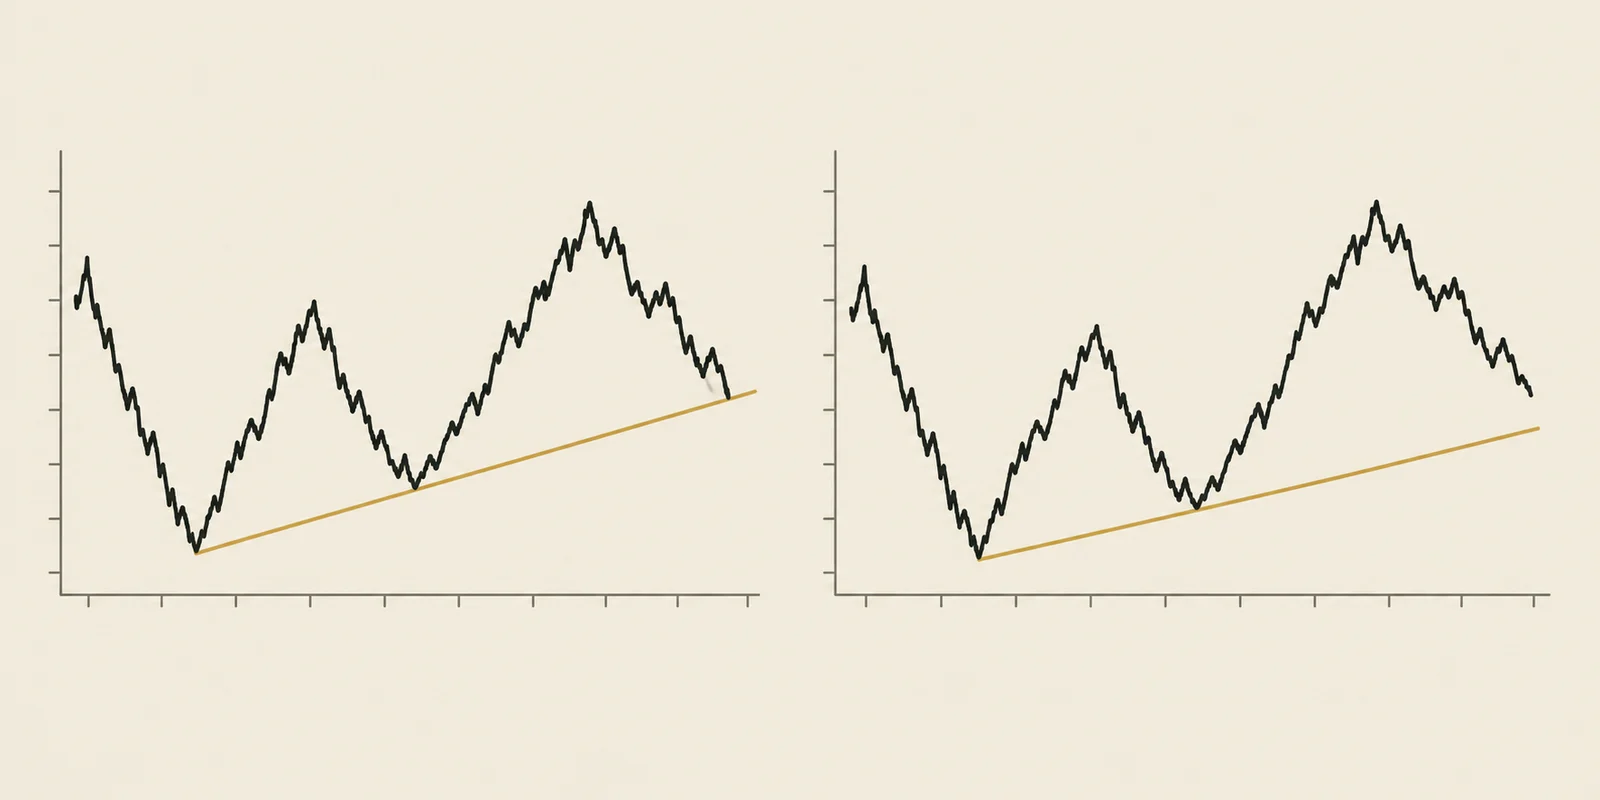
Original research ·
Does a support line make a rebound more likely?
Dips near a support line recovered less often. The line did not give the reassurance you might expect.
Read the studyEducational research, not investment advice. Historical observations do not predict the next trade. TradingPal publishes this research and sells trading software.