A trading idea, tested
Can holding through a pullback hurt the whole account?
You sell when your rule says to, then the stock bounces. Would giving it another chance have been better?

The short answer
Giving a trade another chance can rescue some winners. It can also keep money tied up and let gains slip away. In this older test, holding longer improved the average falling-wedge trade result, yet the account trading several patterns grew more slowly and suffered a deeper decline.
July 2026 exit study · falling-wedge trade panel and a separate multi-pattern account. Study recorded .What if you sell just before the recovery?
Imagine you buy a stock at $50. It reaches your first target of $55, keeps climbing, then starts falling. Your exit rule tells you to sell. You do—and a few days later the price recovers. It is easy to think, “I should have given it more time.”
That single missed recovery is memorable. The trades that keep falling after you leave are easier to forget. To judge whether more patience helps, we need to count both kinds of ending and what happens to the money while we wait.
This study tested a specific extra chance: keep holding when an exit signal arrives after the stock has fallen back below its first target. Would that improve the trades and the account?
We changed one exit rule after the target had been reached
The normal rule did not sell the moment the first target was hit. It allowed the trade to keep running. After reaching that target, it looked for a daily close below the average closing price of the most recent ten sessions. That moving average is a smoother line that helps identify when the recent rise is weakening.
The alternative ignored that exit when the closing price had also slipped below the first target. In our example, a close at $54 below the smoothing line would normally trigger an exit. The alternative would keep the trade open, hoping to give the move more room. The original safety stop still applied.
Illustrative · how the idea works
The extra chance starts after a pullback
Normal rule
Exit below the smoothing line.Extra-chance rule
Keep holding while also below target.We held entries and the other trade rules fixed, then compared the results. We also replayed a limited-capital account across several pattern types, including falling wedges. That second test matters because the account has to live through the waiting, not just collect the final outcomes.
Illustrative · how the idea works
Waiting uses money as well as time
Exit Trade A
Keep holding Trade A
What happened?
In the older multi-pattern account, the normal exit rule produced about 20.1% annualized growth. The hold-longer rule produced about 12.5%. The largest realized decline deepened from about 16% to about 30%. These figures describe that older account, not the current wedge-only simulation in our shape study.
Source: TradingPal’s July 15, 2026 ride-exit / hold-below-target report, reviewed for the falling-wedge episode. Account figures cover several patterns and are not a wedge-only portfolio replay.
See the exact figures and download the table
| Group | Annualized growth | Largest realized decline | Account trades |
|---|---|---|---|
| Normal exit rule | 20.12% | 16.4% | 1,466 |
| Hold longer below target | 12.52% | 30.4% | 1,120 |
Full-span simulation beginning in 2000, recorded July 2026. Annualized growth is a way to summarize the whole period; actual yearly returns varied. This account included several patterns.
| Group | Average result | Winning trades | Trades |
|---|---|---|---|
| Wedge trades, normal exit | 0.521R | 56.6% | Not recorded |
| Wedge trades, hold longer | 0.573R | 49.4% | Not recorded |
Wedge-only trade averages, not account growth. R compares profit or loss with the original planned risk. The saved report does not preserve the wedge panel’s trade count.
Source: TradingPal’s July 15, 2026 ride-exit / hold-below-target report, reviewed for the falling-wedge episode. Account figures cover several patterns and are not a wedge-only portfolio replay.
Download summary results (CSV) ↓A better average trade can still come with a worse account
The falling-wedge trade panel initially makes patience look helpful. Its average result improved from about $52 to $57 per $100 of planned risk, even though fewer trades finished as winners. Some extended trades earned enough to lift the average.
Illustrative · how the idea works
Compare the reward with the risk you planned
But a trading account does not have unlimited money or unlimited time. A position that stays open cannot release its money for another opportunity. And letting a gain shrink before selling can deepen the account’s setbacks. Averages at the finish line leave out that experience.
In the separate account test across several patterns, holding longer meant fewer completed trades, slower growth and a much larger decline from an earlier high. The hold-longer version lost the growth comparison in all 25 paired runs, both over the full period and the more recent period tested.
That does not prove that capital being tied up explains every dollar of the difference, or that every delayed exit is wrong. It shows why “the average trade made more” is not enough to judge an exit rule. Timing, losses along the way and the other trades you can afford also matter.
Return to that $54 exit. A later recovery can make selling feel foolish, but you cannot evaluate the rule from that ending alone. In this historical comparison, the extra chance had a cost across the full set of decisions—even though some individual trades benefited.
What this study cannot tell us
The account finding spans several patterns. It does not establish the size of the effect in a wedge-only account today. We recovered the dated summary, but not the original paired trade rows, so this edition explains the older result rather than claiming a fresh reproduction.
Read all study limitations
- These are historical simulations, not actual customer trades or papers reviewed by independent academic experts. Prices, trading costs and future market conditions can produce different results.
- Several trades can come from the same stock or the same market period. They are not independent coin flips. A large trade count does not turn one historical comparison into a promise about the future.
- The historical universe does not fully represent companies that failed or disappeared. Daily price summaries also cannot show every move within a trading session, and modeled entries or exits may be unavailable in practice.
- The wedge-specific trade panel and the multi-pattern account answer different questions. The account’s growth and drawdown cannot be attributed solely to falling wedges.
- The main account figures omit added trading friction. Realized-equity drawdown can differ from the decline including open positions. Missing original rows limit reproduction and further explanation of the effect.
For readers who want to check the work
How the study was done, sources and download
- Exit comparison
- After the first target has been reached, baseline exits on a daily close below the 10-day simple moving average. Variant suppresses that exit when the close is also below the first target; structural stops and later qualifying exits remain. This is not target-taking versus trailing.
- Trade panel
- Saved falling-wedge panel: win rate 56.6% versus 49.4%; mean original-risk R 0.521 versus 0.573. The panel count is not retained. It cannot be inferred from the separate 1,466 / 1,120 account-trade counts.
- Portfolio
- Multi-pattern, limited-capital simulation. Full window starts in 2000; recent window starts July 15, 2016. Report recorded July 15, 2026; exact final trade date is not preserved. Displayed full-span figures are the clean model without added friction.
- Paired checks
- Holding longer won zero of 25 paired growth comparisons in each window. Mean annualized-growth penalty was 6.2 percentage points over the full span and 9.2 over the recent window. These reuse the same history.
- Evidence available
- The dated report refers to 75,024 paired all-family trades, but the original paired rows were not recovered in the September review. No new wedge-only account result is claimed. Do not compare this account’s level directly with the newer shape study’s baseline.
Source: TradingPal’s July 15, 2026 ride-exit / hold-below-target report, reviewed for the falling-wedge episode. Account figures cover several patterns and are not a wedge-only portfolio replay.
Download methods and limitations (text) ↓Cite this research
Use the article link so readers can see the comparison and its limitations. Describe these as historical simulated results, naming the comparison and its scope. The figures do not predict future returns.
TradingPal Research (2026-09-10). Can holding through a pullback hurt the whole account? Version 1.0. Historical study recorded 2026-07-15. https://tradingpal.io/learn/research/holding-through-pullbacks-study
Questions about the research? Contact TradingPal Research.
Publication and revision record
Version 1.0 · September 10, 2026. First article edition of the study recorded July 15, 2026. The report uses fixed figures; nightly product updates do not change them. Corrections will be dated and explained here.
Keep learning

Falling wedge
A falling wedge has two downward-sloping boundaries that draw closer together.

Risk/reward & R-multiples
A trade’s entry, safety exit and target let you compare its planned loss with its potential gain.
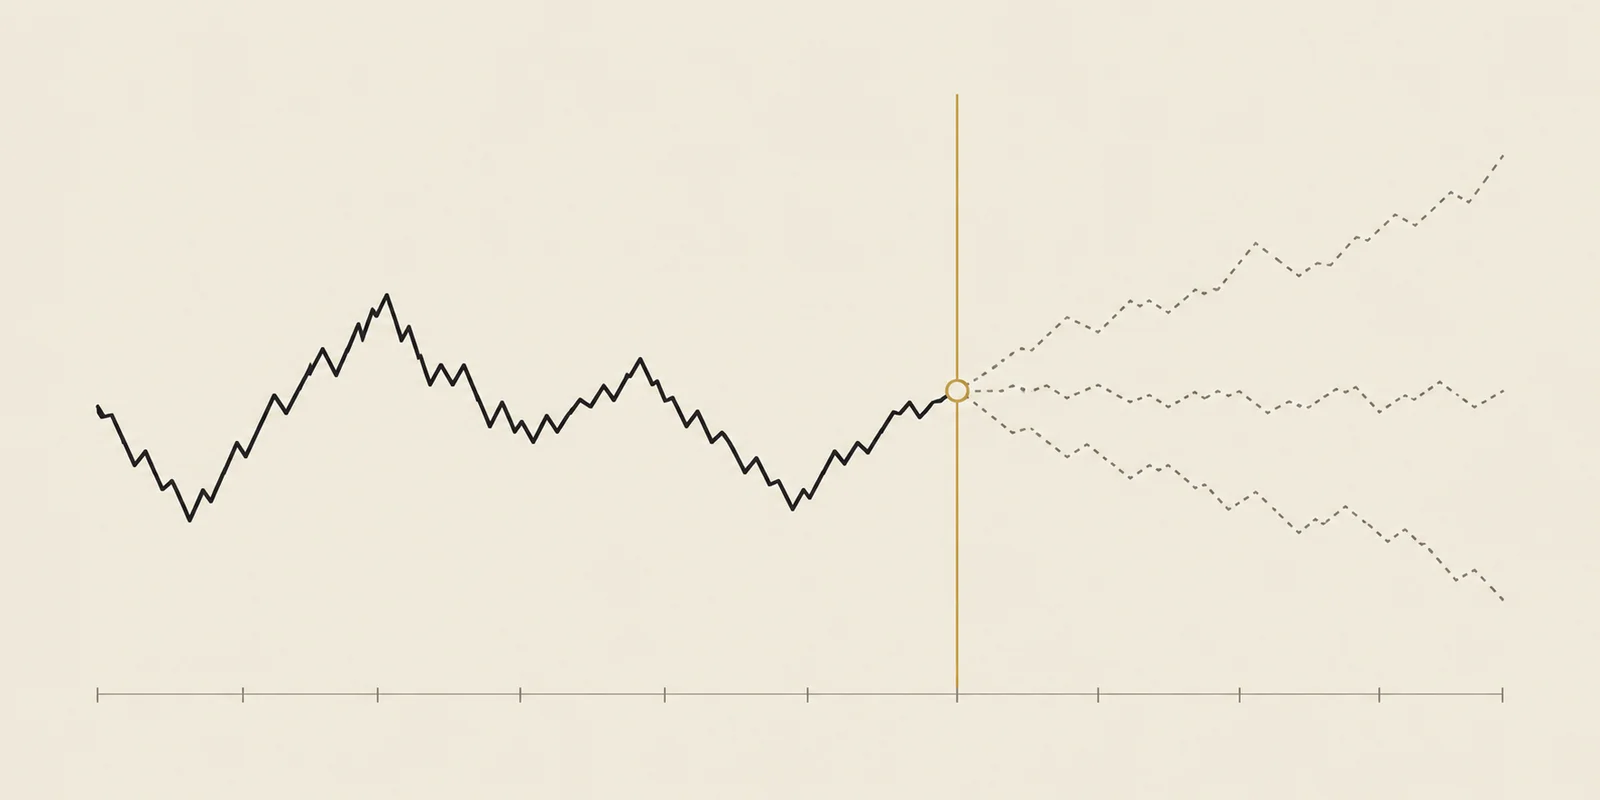
What is backtesting?
Backtesting applies a trading rule to historical prices and records the simulated outcomes.
Another question we tested

Original research ·
Does a tighter falling wedge make a better trade?
Removing the confirmed loose wedges reduced the simulated account’s growth.
Read the study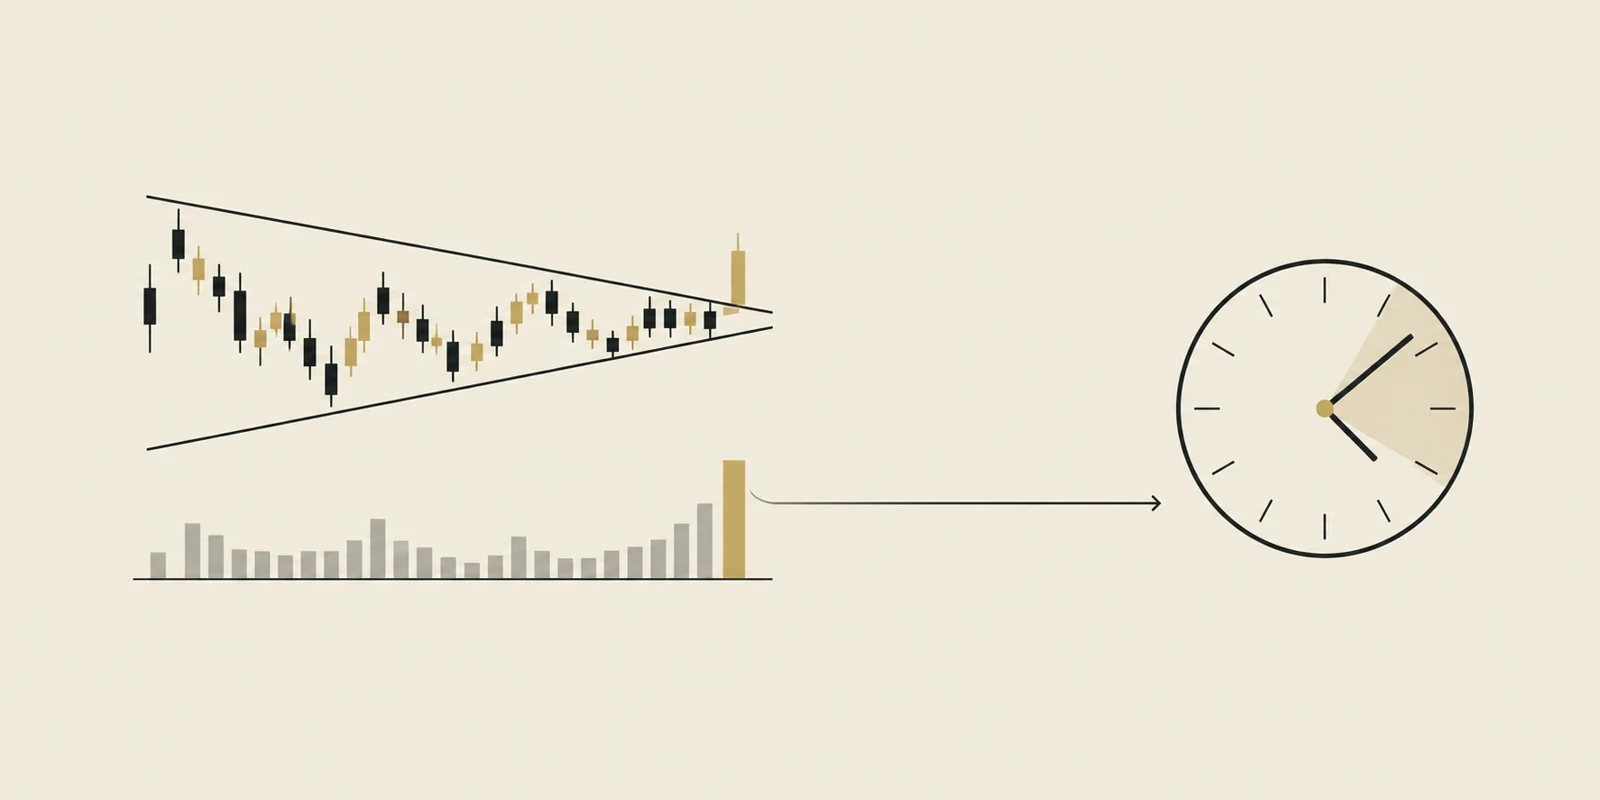
Original research ·
Does volume matter before a breakout?
High volume in the completed breakout bar looked favorable. Evidence for volume known before entry was weaker.
Read the studyEducational research, not investment advice. Historical observations do not predict the next trade. TradingPal publishes this research and sells trading software.