--Typical return71.4%Won--Post breakout
DIA
The Resistance trendlines strategy tests ETF trades near weekly or monthly resistance. The entry sits below the line, the safety exit above it, and the cover rule determines when the position closes.
Resistance trendlines is TradingPal’s named ETF setup for a bearish position near weekly or monthly resistance. A short position sells borrowed shares and later buys them back, a process called covering. A lower cover price produces a gain before costs; a higher one produces a loss.
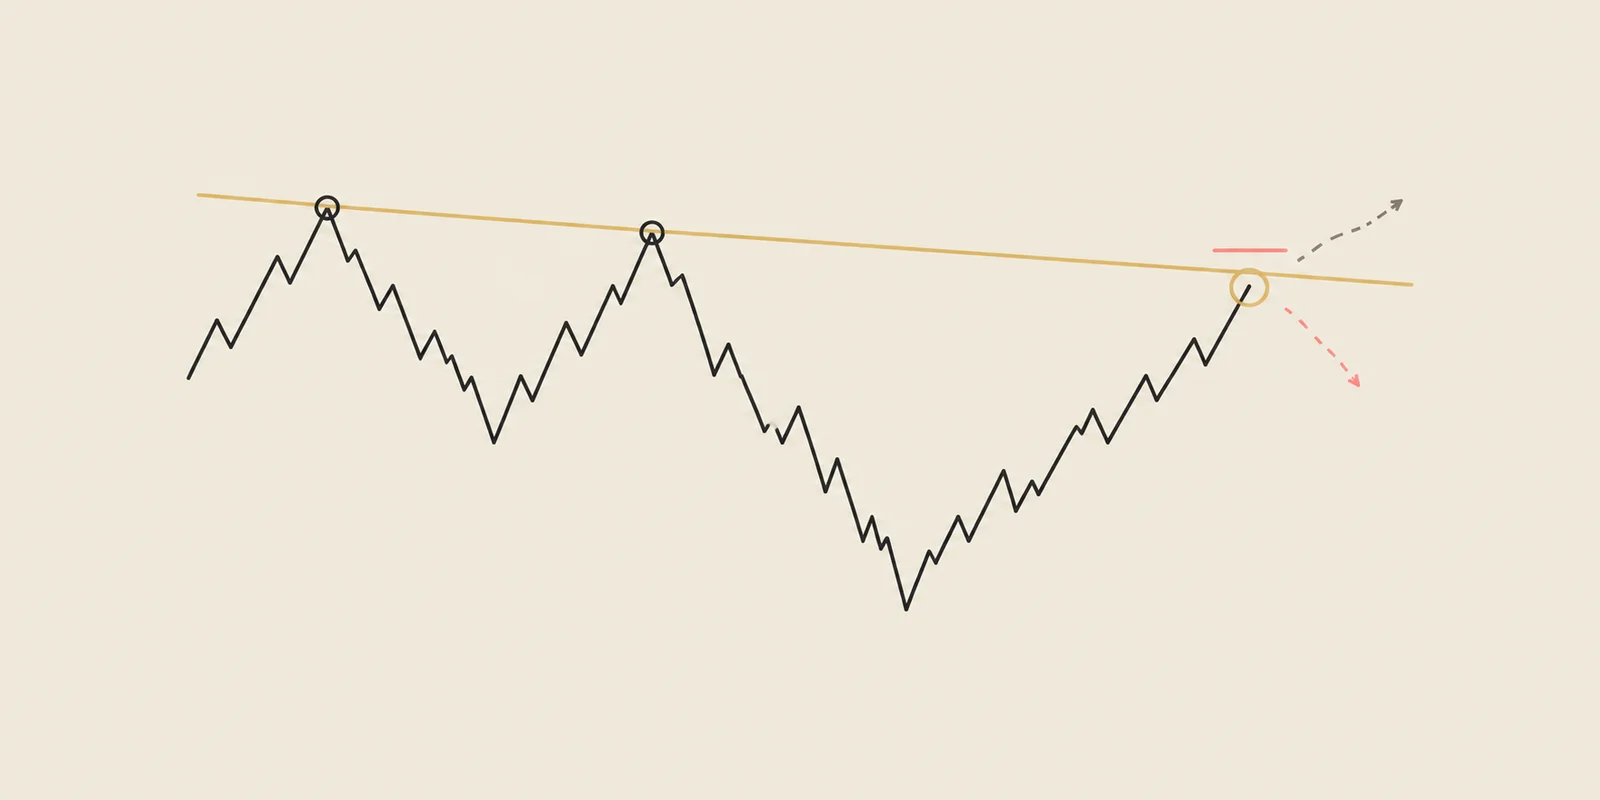
Imagine an illustrative ETF rising toward resistance near $100. The trade requires a specified entry below that area and a safety exit above it. The support and resistance guide explains how the price role is identified.
The position may remain open for weeks or months. Its cover rule and safety exit use the chosen weekly or monthly interval.
Resistance Smash is another product name for this resistance-side setup. The trendline strategy guide explains how its trade levels fit together.
The tested short entry sits slightly below qualified resistance. Its position depends on the weekly or monthly interval and nearby Fibonacci context. The order becomes eligible when price reaches the level.
If price falls away before filling the entry, the order misses the trade. Selling short after a large decline changes the distance to both the stop and target.
The planned stop is above resistance and defines risk per share. The record waits for closing-price confirmation rather than exiting on every brief crossing.
A monthly trade exits after one qualifying monthly close above the stop. A weekly trade requires two qualifying weekly closes. The exit occurs at that close, which can be worse than the planned price after a gap or overshoot. The risk/reward guide explains how that affects realized R.
The monthly version includes a resting 2R cover order from the candle after entry. A qualified support target can instead govern the exit when selected by the tested target rule. The setup card distinguishes an actionable target from a displayed 2R progress benchmark.
The weekly version manages the position toward qualified support or its defined moving-average exit. Closing on a shorter daily move would change the rule and require a separate historical test.
The historical results below apply only to this ETF-scoped setup. They do not describe every rally, every resistance line, or individual stocks outside the tested universe. How TradingPal backtests trendlines explains how that scope stays fixed.
Weekly supplies the primary sample and monthly offers the slower comparison. The holding period matters when you read average R and Sharpe ratio: these are historical results from the same entry, risk, and target rules, with weeks or months for a qualified move to mature—not evidence of instant or guaranteed profit. A current setup is simply an example from the latest scan, not a promise or a claim that it is the Morning Brief's top-ranked idea. The track-record metrics guide explains what those numbers do and do not mean.
Historical simulation of the complete named setup, not a generic trend-line result. Weekly is the primary view. Read the methodology →
1 structure found. See example
The day's #10 ranked setup, in your inbox.
Every morning we hand you the highest-ranked breakout structure found in our scan across 2,600+ tickers — Free.
See the full offeringRead these limits with the table below.
The sample, instrument scope and dates belong to this exact setup book. Extreme drawdowns remain visible rather than being hidden.
| View | Scope | Trades | Win rate | Average trade | Profit factor | Max drawdown |
|---|---|---|---|---|---|---|
| Weekly | ETFs | 173 | 63.0% | +0.23R | 1.19 | 24.2% |
| Monthly | ETFs | 101 | 54.5% | +0.24R | 1.24 | 28.0% |
Backtest window: 2021-12-27 to 2026-06-29. Data snapshot: 7/23/2026. Historical results can differ from live fills and do not predict future performance.
It uses a short position, but the systematic version is narrower: ETF scope, qualified weekly or monthly resistance, an entry band below the line, a close-confirmed stop above it, and a declared cover rule.
That is the instrument scope used by the named reproducible setup. The published statistics should not be generalized beyond it.
Resistance Smash is the product alias for the same Resistance trendlines setup family, so both labels share one canonical rules guide.
Price can break resistance and accelerate higher. A predefined structural stop and risk-based position size are essential.
The setup is based on weekly and monthly resistance, so a position can remain open for weeks or months while price moves toward the next major support target. The structural stop still governs risk for the full holding period.
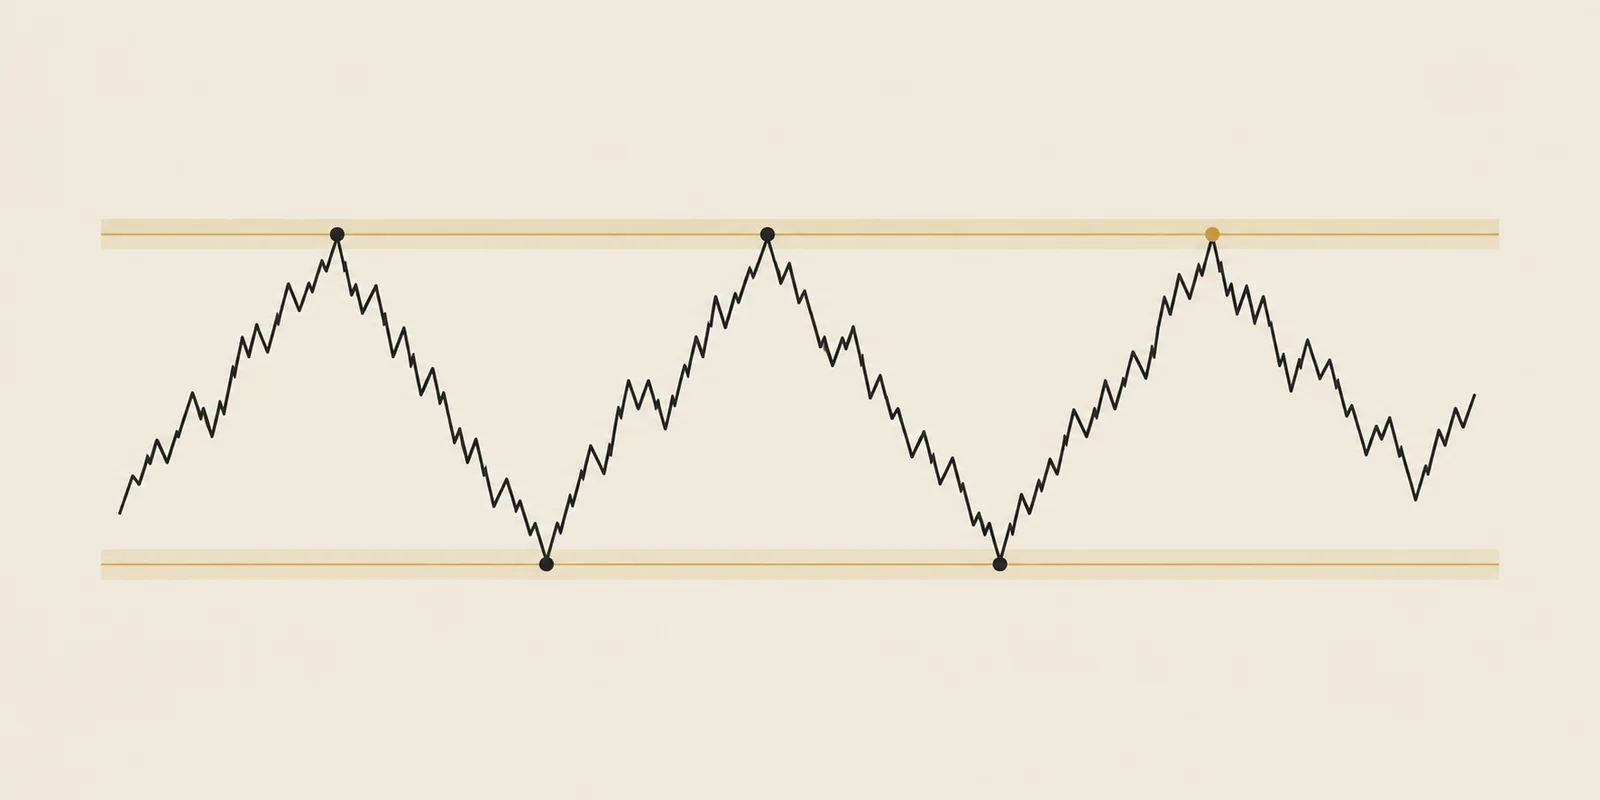
Support and resistance mark areas where earlier declines or rallies stopped.
A trendline trade needs rules for choosing the line, entering, sizing the position and exiting.
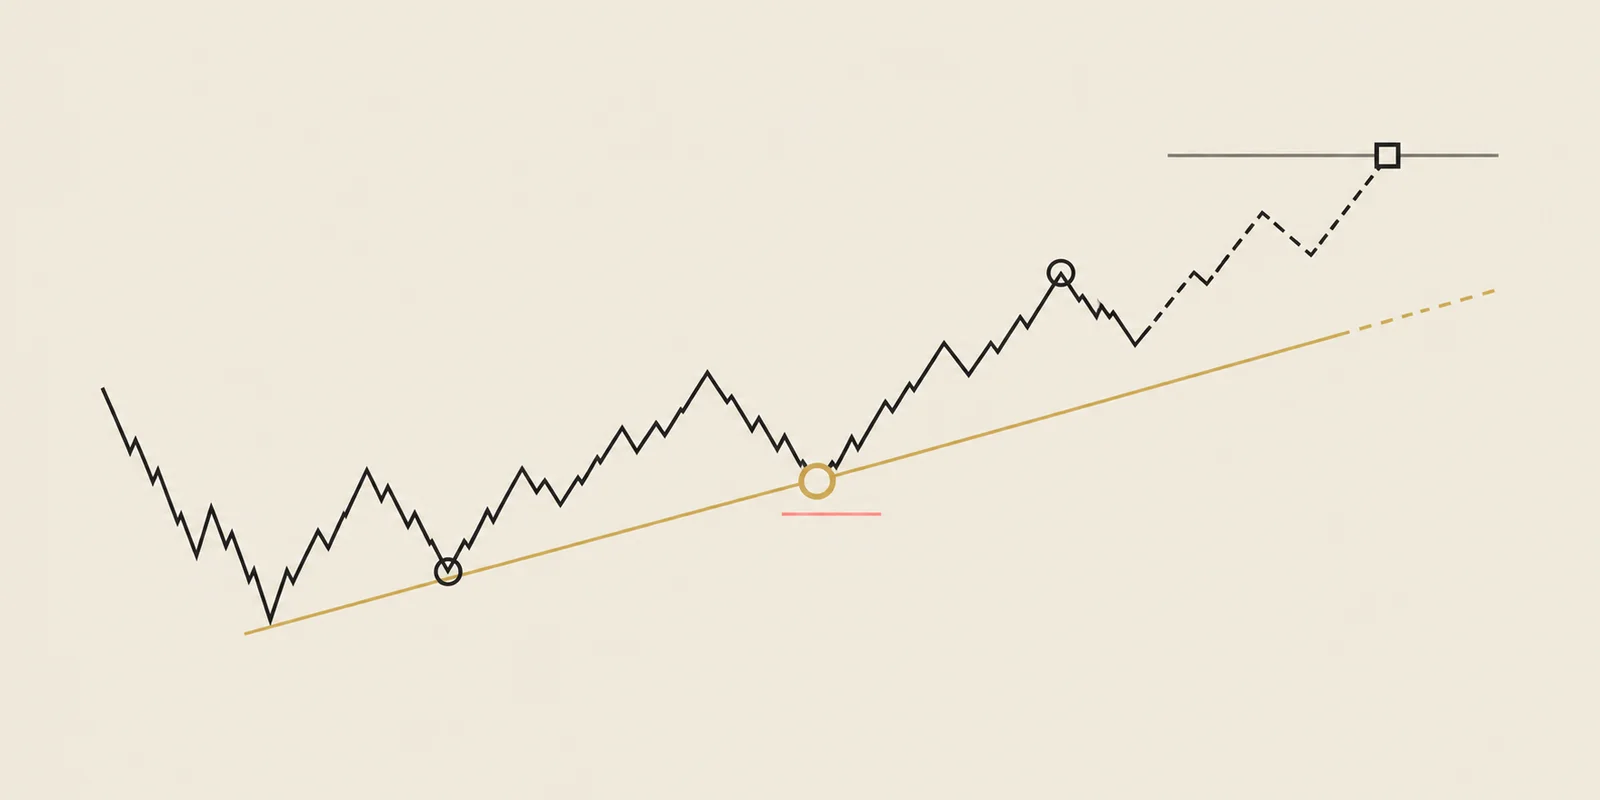
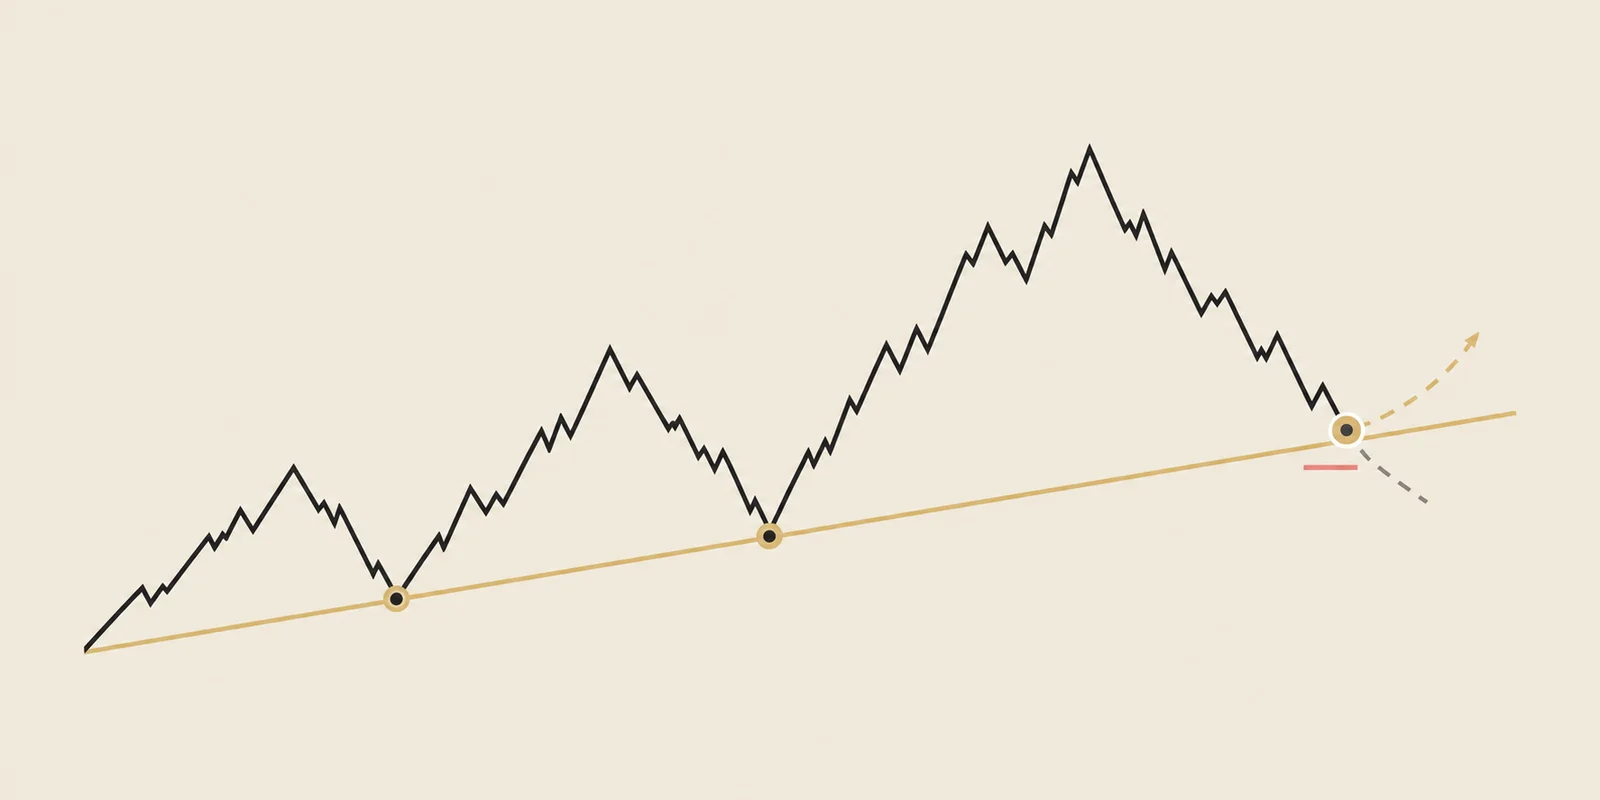
The Support trendlines strategy uses a planned entry above a qualifying support line on weekly or monthly charts.
Open the screener to compare current setups, their visible lines and their historical track records.
Explore the screener →Educational content, not investment advice. Backtests are historical simulations and do not predict the next trade.