--Typical return27.8%Won--To entry
SHY
The Support trendlines strategy uses a planned entry above a qualifying support line on weekly or monthly charts. Learn how the line, safety exit and target determine the position and its holding period.
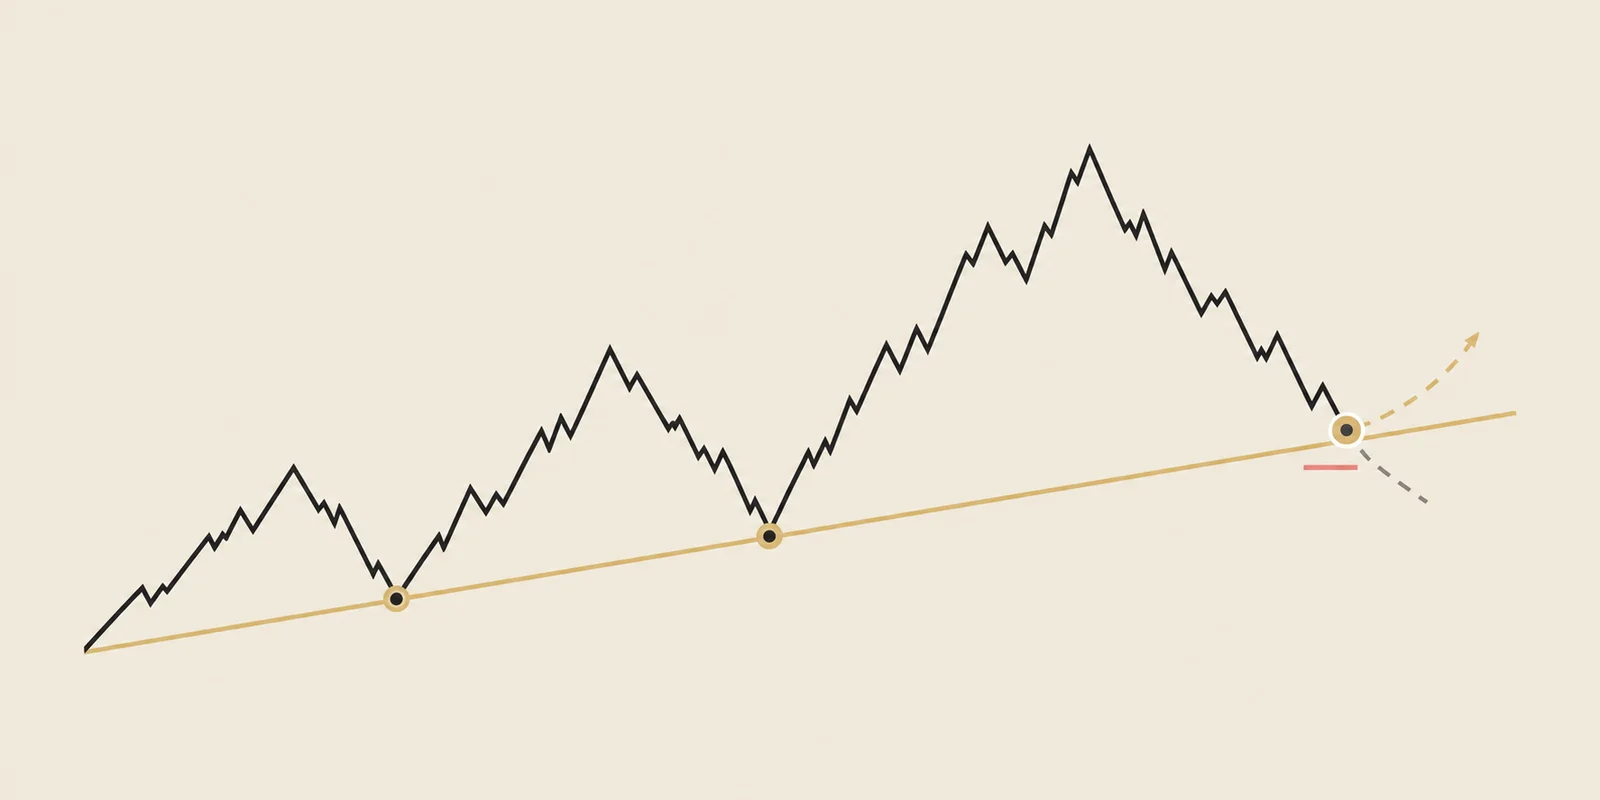
Buying at support means entering near an area where earlier declines recovered. TradingPal’s named setup requires qualified support on a weekly or monthly chart, with an entry above the line and a safety exit below it.
Imagine an illustrative support line near $100 as price approaches from above. The question is whether an entry near that line, with specified exits, has produced gains large enough to cover its losses. The support and resistance guide explains the location.
The chart interval affects the holding period. A weekly or monthly position can remain open for weeks or months while it moves toward the next resistance or meets another exit condition.
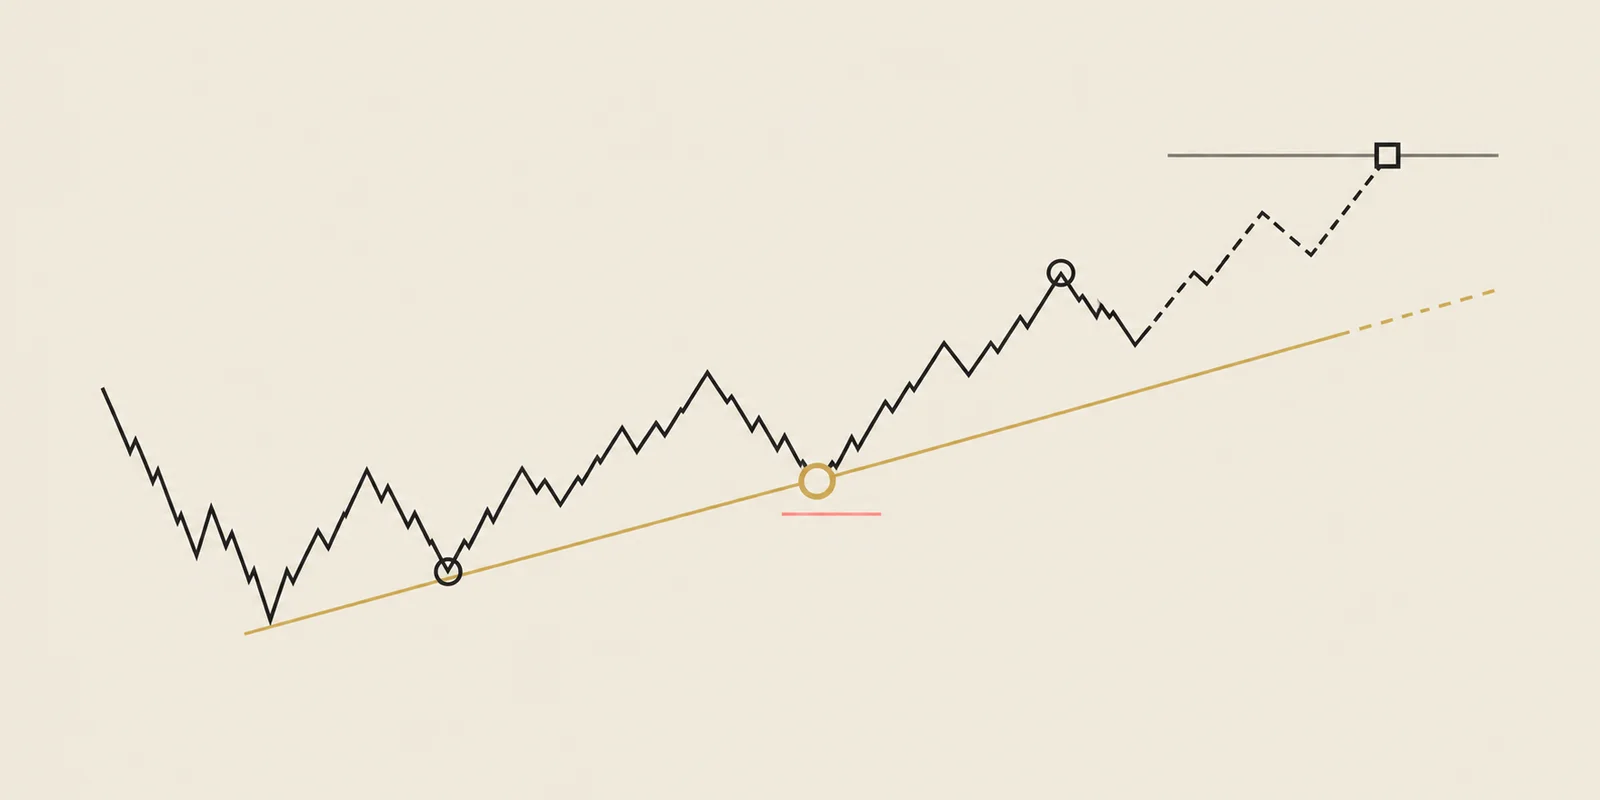
The chart shows the resulting trade levels. The trendline strategy guide explains why entry, position size and exit must be defined together.
The tested entry sits slightly above qualified support. Its position depends on the weekly or monthly interval and nearby Fibonacci context. The level can be marked before price arrives.
If price recovers before reaching the entry, the order misses the trade. Buying higher would increase the distance to the planned stop and reduce the distance to the target.
The planned stop is below support and defines risk per share. The record waits for closing-price confirmation rather than exiting on every brief crossing.
A monthly trade exits after one qualifying monthly close below the stop. A weekly trade requires two qualifying weekly closes. The exit occurs at that close, which can be worse than the planned price after a gap or overshoot. The risk/reward guide explains how that affects realized R.
When a qualified resistance level exists above entry, it supplies the historical target. If there is no qualified target, the long policy waits for price to regain its 10-candle moving average, then exits on a later close below it. The candles are weekly or monthly according to the setup.
A targetless trade may display a 2R level to show twice the planned risk. That line is a progress benchmark; the historical exit follows the moving-average rule. In the illustrative support example, both the waiting period and the final exit therefore depend on the selected chart interval.
A support line by itself was not enough to predict a bounce in our comparison tests. The results below belong to the full Support trendlines strategy: the same line rules, entry, safety exit and target on every trade.
The weekly test is our main study, and the monthly test shows the slower version. Those longer holding periods matter when you read average R and Sharpe ratio. The strategy gives a good trade weeks or months to reach its target; it does not create quick wins or guarantee that the next dip will bounce. The track-record metrics guide shows how holding period, return, and drawdown fit together.
The live example comes from the latest market scan. It shows how the rules look today, but it is not added to the historical results until its outcome is known.
Historical simulation of the complete named setup, not a generic trend-line result. Weekly is the primary view. Read the methodology →
162 structures found. See example
The day's #10 ranked setup, in your inbox.
Every morning we hand you the highest-ranked breakout structure found in our scan across 2,600+ tickers — Free.
See the full offeringRead these limits with the table below.
The sample, instrument scope and dates belong to this exact setup book. Extreme drawdowns remain visible rather than being hidden.
| View | Scope | Trades | Win rate | Average trade | Profit factor | Max drawdown |
|---|---|---|---|---|---|---|
| Weekly | 598 symbols | 6,555 | 33.8% | +3.10R | 2.12 | 100.0% |
| Monthly | 514 symbols | 2,743 | 43.8% | +9.97R | 5.34 | 74.2% |
Backtest window: 2021-12-06 to 2026-07-13. Data snapshot: 7/23/2026. Historical results can differ from live fills and do not predict future performance.
We draw support through earlier swing lows where declines stopped and price turned up. Price must approach the line from above, and the same line rules are used before the outcome is known.
Do not buy a drop just because it looks cheap. Start with qualified support, use the tested entry and stop bands, and follow the close-confirmation rule on the same weekly or monthly timeframe. Weekly stops require two qualifying closes.
The setup comes from weekly and monthly charts, so a trade can stay open for weeks or months while price moves toward the next resistance level.
Yes. A strategy can lose more often than it wins if the average winner is much larger than the average loser. Read win rate together with average R, profit factor and drawdown.
They are two names in TradingPal for the same support-side setup. Both use the rules and historical results on this page.
Support and resistance mark areas where earlier declines or rallies stopped.
A trendline trade needs rules for choosing the line, entering, sizing the position and exiting.
The Resistance trendlines strategy tests ETF trades near weekly or monthly resistance.
Open the screener to compare current setups, their visible lines and their historical track records.
Explore the screener →Educational content, not investment advice. Backtests are historical simulations and do not predict the next trade.